

This is not the usual comparison
Most of our comparison posts line two products up feature-by-feature because they are genuinely trying to do the same job. This one is different, and pretending otherwise would waste your time.
Cloudflare did not build Web Analytics to win an analytics market. They built it as a free perk for people already on their network: a privacy-first JavaScript beacon that tells you roughly how many people visited, where they came from, and (its real strength) their full Core Web Vitals scores. Analytics is not Cloudflare's business. Bandwidth and security is. Web Analytics is the gauge that comes bundled with the car.
WireBoard is the opposite. The dashboard is the product. Its entire reason to exist is to answer "what are my visitors doing right now, where do they drop off, and what is each segment worth."
So the question isn't "which one wins." A free gauge and a cockpit aren't competitors. The question is whether the gauge is enough for what you're doing, and the moment it isn't, what you reach for instead.
What Cloudflare Web Analytics is genuinely good at
Let's be fair before we're useful. If any of these describe your situation, Cloudflare Web Analytics may be all you need, and it costs nothing.
It is free, with no plan to outgrow. It surfaces the full Core Web Vitals suite (LCP, INP, CLS) from a real-user-monitoring beacon as a first-class metric. WireBoard tracks performance too, including page-load timing and engagement signals like time on page, but the complete Core Web Vitals breakdown is something Cloudflare leans into harder, and does well. If your site is already proxied through Cloudflare, the edge analytics can't be blocked by ad blockers, because Cloudflare measures the request at its own network before any browser extension gets a vote. Setup is near-zero on a proxied domain. And it keeps six months of history for free.
For a brochure site, a portfolio, a side project, or anyone whose only real question is "is my site fast and roughly how busy," that's a complete answer. Keep it.
Where the gauge stops
The same scope choice that makes Cloudflare Web Analytics free and simple also draws a hard line around what it can tell you. These aren't bugs. They're the edge of what a bundled performance beacon was ever meant to do, and they're confirmed in Cloudflare's own documentation.
No custom events. "Not yet," per the docs. You cannot track a sign-up, an add-to-cart, a video play, or a button click.
No funnels. With no events, there is nothing to sequence. You cannot see where people abandon a checkout or a multi-step form.
No revenue tracking. No way to attach a value to anything, so no revenue-by-source, no revenue-by-plan.
No UTM parameters. Cloudflare deliberately doesn't log query strings, so your campaign tags are invisible. Marketing attribution is off the table.
No real time. Data is unsampled for 7 days, then aggregated down to roughly 10% for storage, with further query-time sampling. There is no live concurrent-visitor counter and no streaming feed.
No dashboard you control. You read the layout Cloudflare gives you. No custom widgets, no boards, no per-client views.
In short: it answers how many and how fast. It cannot answer who, doing what, worth how much, right now.
Where WireBoard picks up
WireBoard is built for exactly the questions the gauge can't reach, and ships them on every plan, including the permanent free one.
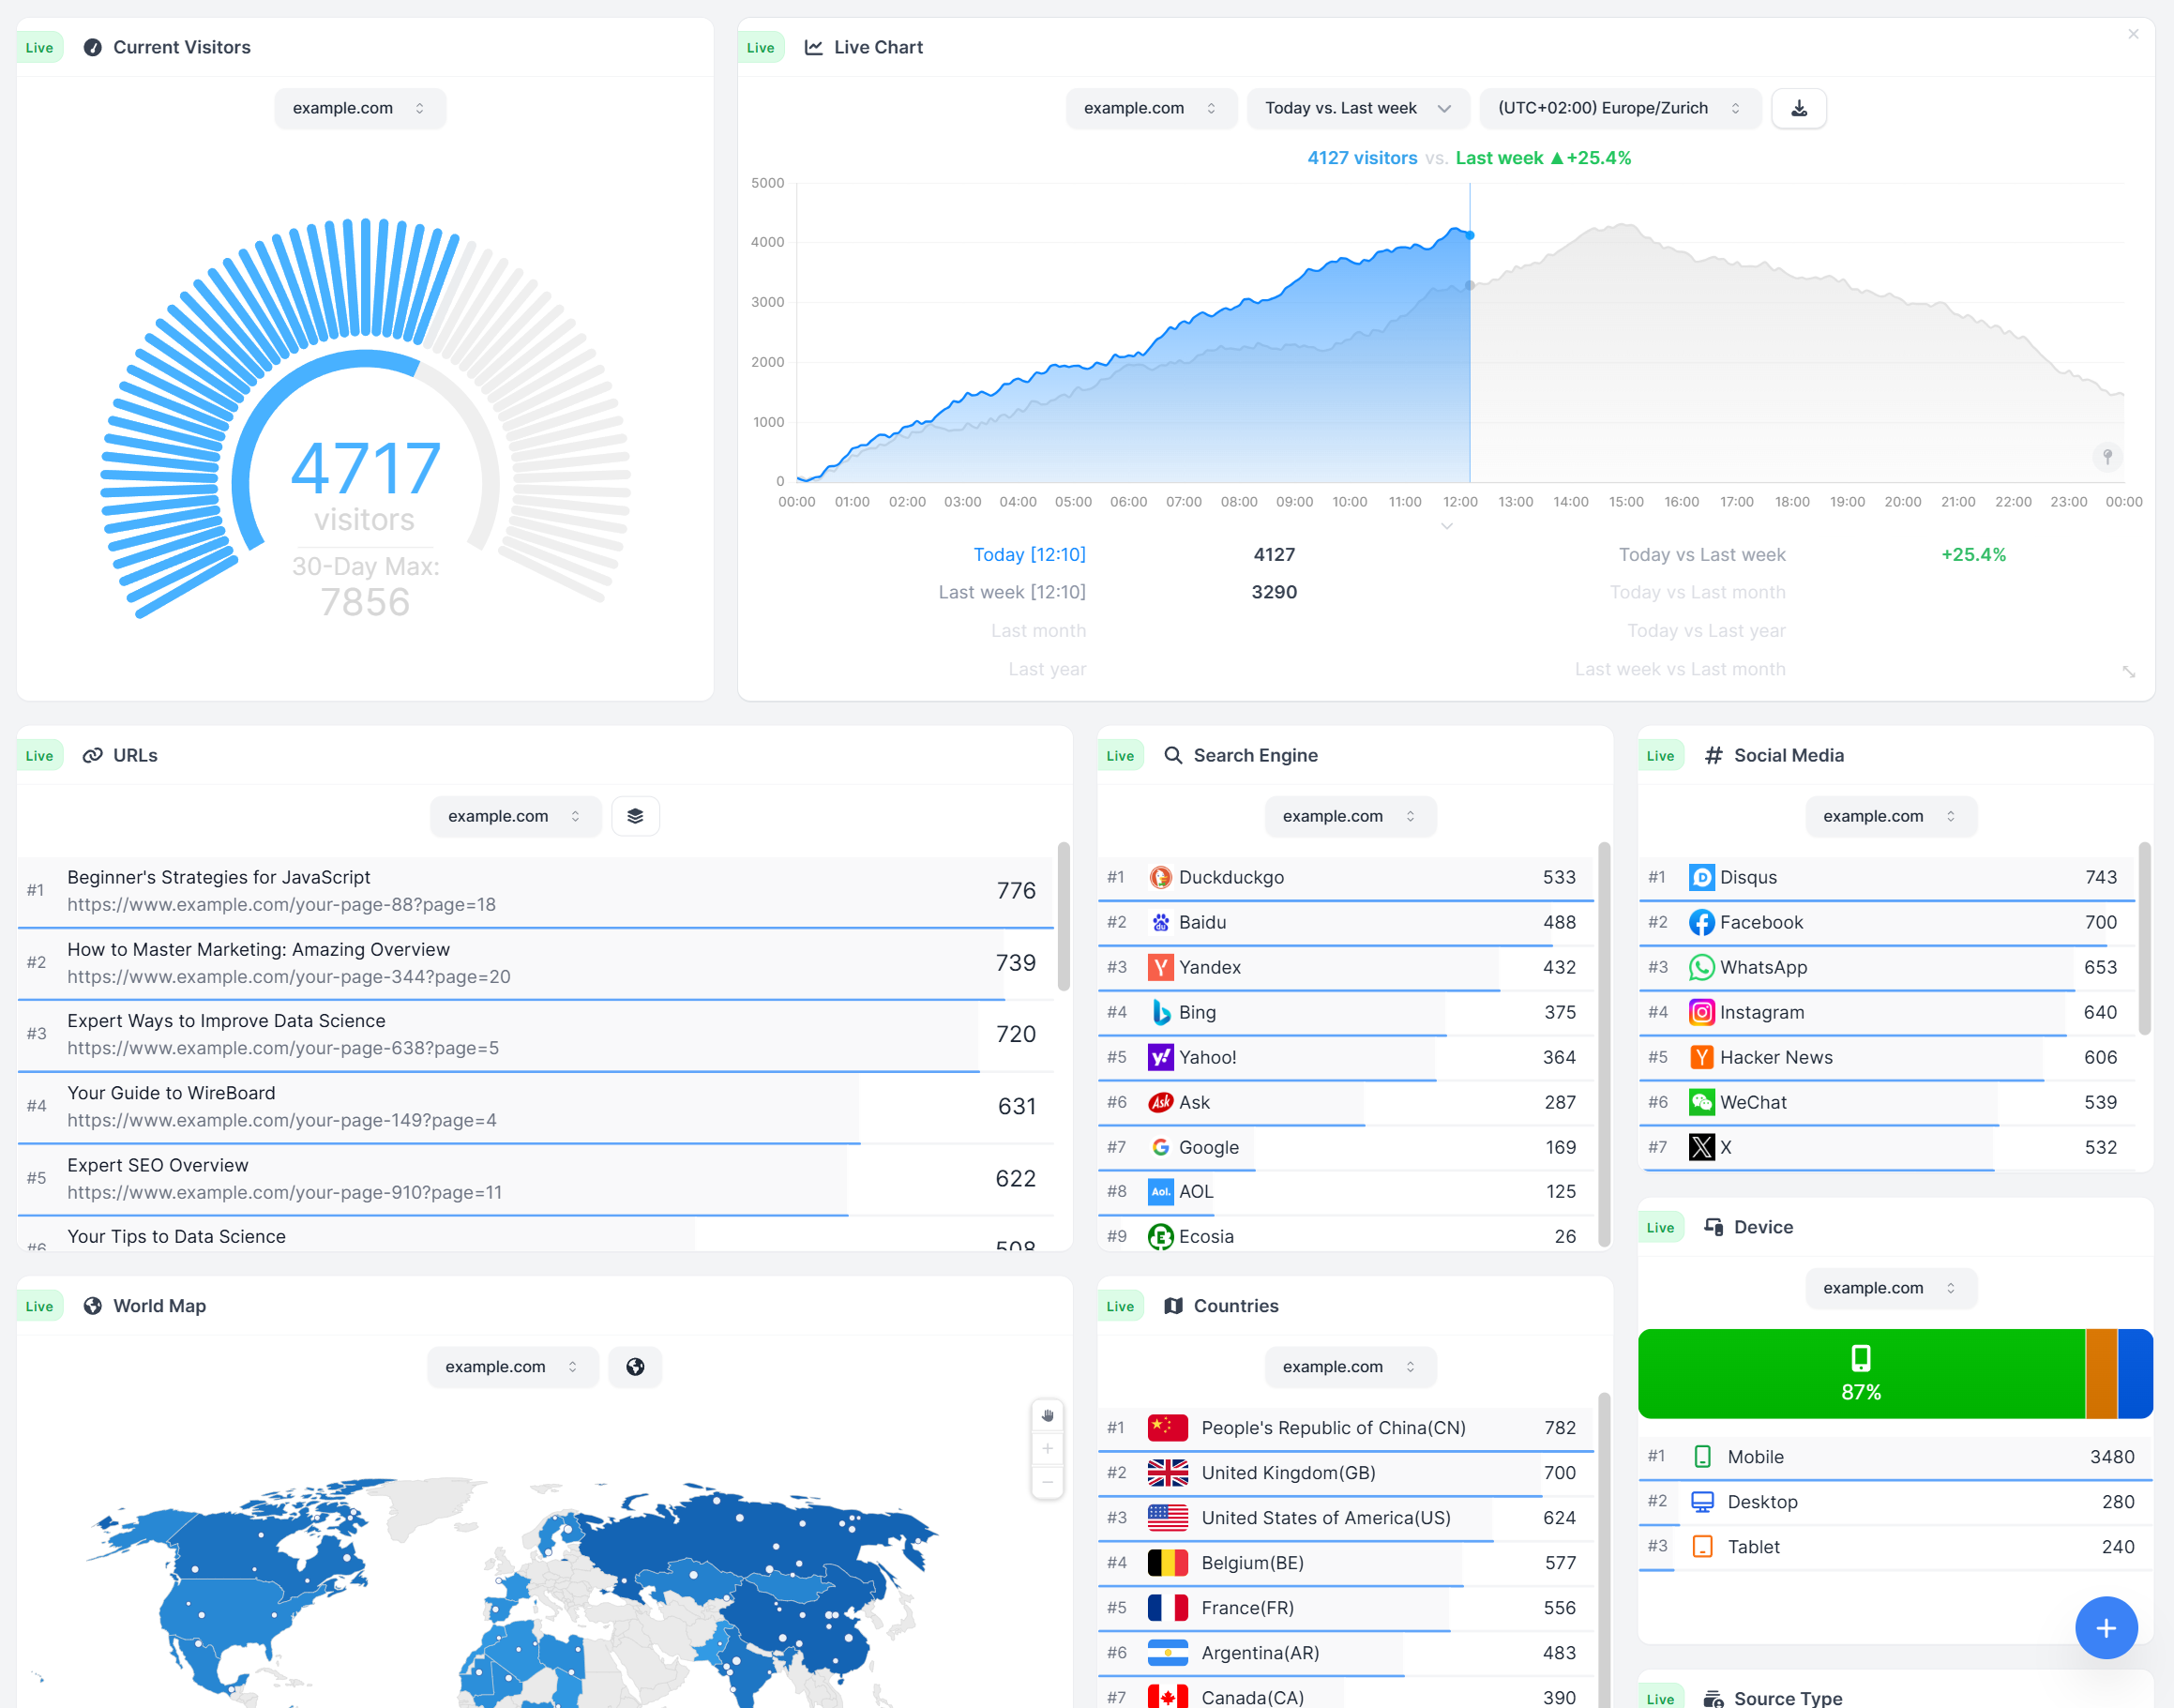
It streams, live. A concurrent-visitor counter and a live view of the URLs being read right now update the instant a hit lands, alongside a live world map, traffic-sources panel, device breakdown, and a real-time event feed. This is the difference between a tab worth leaving open during a launch and a report you check tomorrow.
It tracks events, funnels, and revenue on the free plan. Define custom events, attach a revenue value, and build real-time funnels that mix pageviews, sessions, and events in any order, with live drop-off. Break revenue down by event property, like revenue per plan tier on a SaaS sign-up.
It segments by anything. A three-slot tag system (:tag1 / :tag2 / :tag3) plus arbitrary custom props let you slice any chart by device, country, source, campaign, or a dimension you invented, in a click.
It's a dashboard you build. 60+ drag-and-drop widgets, multiple boards per site, three themes. A live ops board, a weekly-review board, and a client-facing board, side by side.
It reads all your sites at once. Pick any combination of sites and their live numbers merge into a single streaming widget, the view a CDN byproduct with a 10-site soft limit and per-site pages never offers.
It watches the SERP, too. A live SERP volatility score and a Google core-and-spam-update timeline sit next to your traffic, so an algorithm rollout and a traffic dip share one screen.
It has a real API. A read-only REST API, a Live Server-Sent-Events stream, official JavaScript and Python SDKs, and an MCP server that lets Claude or Cursor query your analytics inline.
The honest at-a-glance
Cloudflare Web Analytics | WireBoard | |
|---|---|---|
Core purpose | Free traffic + performance gauge | Dedicated analytics product |
Price | Free | Free plan + paid from $9/mo |
Full Core Web Vitals suite (LCP/INP/CLS) | Yes, first-class | Partial: page-load timing, not full CWV |
Ad-blocker resistant (edge) | Yes, if proxied through Cloudflare | No (JS beacon) |
Custom events | No | Yes, every plan |
Funnels | No | Yes, every plan, real-time |
Revenue tracking | No | Yes, every plan |
UTM / campaign tracking | No | Yes |
Real-time / live streaming | No (sampled, aggregated after 7 days) | Yes, streaming widgets |
Custom dashboards | No | 60+ widgets, multiple boards, 3 themes |
Multi-site live view | Per-site, ~10-site soft limit | All sites, one streaming widget |
SEO / SERP volatility | No | Built in |
API | GraphQL (read) | REST + Live SSE + SDKs + MCP |
History | 6 months | 30 days (free) / 3 years (paid) |
Hosting | Cloudflare global edge | EU infrastructure (SwissOps Ltd.) |
If you're searching for a Cloudflare Analytics alternative
Most people who land here aren't unhappy with Cloudflare. They've just hit the edge of what a free gauge can do: they want to track a sign-up, see where a checkout leaks, tag a campaign, or watch the site move in real time, and Cloudflare Web Analytics doesn't go there by design.
If that's you, WireBoard is the Cloudflare alternative that adds the missing layer without taking anything away. Custom events, funnels, revenue tracking, segmentation, live streaming widgets, and a dashboard you actually build, all on every plan including the free one. You don't even have to switch on day one. Add the WireBoard script next to Cloudflare's beacon and compare the two dashboards on your own traffic.
Pros and cons at a glance
WireBoard | Cloudflare Web Analytics | |
|---|---|---|
+ | ✅ Custom events, funnels, revenue tracking on every plan, free included | ✅ Completely free |
− | ❌ No full Core Web Vitals suite (page-load timing only) | ❌ No custom events, funnels, or revenue tracking |
So: which, and when?
Keep Cloudflare Web Analytics if your real question is performance and rough traffic, you want it free and zero-maintenance, and you're already on Cloudflare's network. It's a good gauge. There's no reason to rip it out.
Add, or move to, WireBoard the day you ask a question the gauge can't answer: where people drop off, which campaign drove revenue, what's happening on the site right now, how a Google update is moving your traffic, or how all your sites are doing in one view. The free plan covers 50,000 pageviews a month, two sites, every feature, no credit card, so you can run it next to Cloudflare and decide with your own data.
They're not really rivals. One tells you the engine's running. The other lets you fly the thing.
Should you trust this?
I built WireBoard. I've kept Cloudflare Web Analytics running on sites of my own. It's free and the Core Web Vitals data is good. This post says plainly where it's the better, cheaper choice, because for a lot of sites it is. Where WireBoard does something a bundled CDN beacon structurally can't, the post says that too, and links to Cloudflare's own docs so you can check the gaps yourself.
WireBoard is used by publishers who watch traffic move for a living, including Robert Farrington of The College Investor and Barry Schwartz of Search Engine Roundtable, who covers Google algorithm activity daily.
Start tracking for free with WireBoard. 50,000 pageviews per month, 2 websites, every feature included. No credit card. Run it alongside Cloudflare and let the dashboards make the case.
Sources
WireBoard
Cloudflare Web Analytics (where the claims about their product are grounded)