

Which should you pick: WireBoard or Pirsch Analytics?
Both products are sold as privacy-first alternatives to Google Analytics. Both are made in Europe and hosted in the EU (WireBoard by SwissOps Ltd. in Switzerland, hosted in the EU; Pirsch by Emvi Software GmbH in Germany). The buying decision is not "which one is more private." It is which feature surface you actually get on the plan you can afford, and how each product behaves once you put it on a working site.
Pick Pirsch Analytics if you need an on-premise deployment: Pirsch offers it on its Enterprise tier, and WireBoard does not currently offer one.
Pick WireBoard if you build funnels and need revenue tracking and segmentation without an upgrade gate; if you keep an analytics tab open during launches, ad bursts and algorithm-rumble mornings and you want it to keep moving rather than refresh; if you run several sites and want their live numbers combined into one widget instead of clicking between dashboards; or if SERP volatility and Google algorithm activity are something you watch alongside your traffic charts.
What follows: the scoreboard, the three capabilities Pirsch puts behind its Plus tier, the two product-level differences that hold across every tier, the pricing math, and a way to test both on a working site this week.
At a glance
WireBoard | Pirsch Analytics | |
|---|---|---|
Funnels | Real-time, on every plan including free | Plus tier ($12/mo), up to 8 steps |
Custom event metrics + revenue tracking | Every plan including free | Plus tier ($12/mo) |
Segmentation / A/B testing via tags | Cross-filter tags on every plan | Plus tier ($12/mo) |
Real-time surface | Streaming live widgets, real-time funnels, live event feed | Real-time dashboard (marketed) with refresh |
Multi-site live aggregation | Yes, in one widget, streaming | Per-site dashboards |
Dashboard layout | 60+ widgets, drag and drop, multiple boards per site, 3 themes | Fixed page layout per site, custom themes on Plus |
SEO suite (SERP volatility, Google updates) | Included on every plan | Not offered |
Read-only public API | Yes, REST + Live (SSE) streaming, plus official JS/Python SDKs and MCP server | Yes, REST on every plan |
Built-in URL shortener | Not offered | Yes, on every plan |
Permanent free plan | Yes, every feature, 50k PV/mo | No (30-day free trial only) |
Entry-point price | $9/mo (Micro): 100k PV, 50 sites, 3 seats | $6/mo (Standard) at 10k PV |
Hosting and data path | Full in-house pipeline on EU infrastructure | Cloud (Germany) on Standard and Plus, on-premise on Enterprise |
Cookieless mode | Optional toggle, off by default for accuracy | Always on, no toggle |
Open-source self-host option | No | Go library on GitHub, on-premise on Enterprise tier |
Imports | Not offered | Google Analytics, Plausible, Fathom (every plan) |
Data retention | 30 days (Free) / 3 years (paid) | Unlimited |
Most reviews compare the wrong thing. The frame that matters is the unlock map.
If you read three Pirsch reviews in a row, you will see the same shortlist of points: cookieless, hosted in Germany, easy to install, real-time dashboard, GDPR friendly. Those are all accurate. WireBoard delivers on every one of those points too, from a Swiss-EU footprint. The privacy column on both sides of the table is closer to a tie than a real divider.
The real question for a buyer is more practical. Imagine you sign up today. Which features can you use the moment your script tag goes live, and which ones require a plan upgrade later? Comparison posts almost never frame it this way. The result is buyers who pick the cheaper plan, then discover six weeks in that the feature they actually need (funnels, revenue tracking, tag-based segmentation, white-label dashboards) is behind a tier they did not budget for.
The rest of this comparison is built around the unlock map. Three features Pirsch puts on its Plus tier and how WireBoard handles each. Then two product-level differences that have nothing to do with plans at all.
Three features Pirsch gates to Plus, and how WireBoard ships them
I have spent time on both products. The pattern below is not a guess. The Pirsch pricing page and features matrix label each capability with its tier; these three are the ones a working analytics buyer trips on most often.
1. Funnels
Pirsch ships multi-step funnels on the Plus tier. The Standard tier ($6/mo entry) does not include them. The funnels documentation describes up to eight steps with filter options per step.
WireBoard ships real-time funnels on every plan, including the permanent Free Plan. The first step is always a session; from there, pageviews and custom events can be combined in any order, and the live funnel widget updates with drop-off as visitors progress.
If your work involves a checkout, a sign-up sequence, a multi-step lead form or any other flow where you care about where people leave, the gating matters. On Pirsch, the upgrade from $6 to $12 a month is the price of seeing the funnel. On WireBoard, the funnel is part of the entry plan and the free plan.
2. Custom event metrics and revenue tracking
Pirsch tracks events on every plan. The piece that lives behind Plus is the metric layer on top of those events, plus e-commerce revenue tracking. Defining a numeric custom metric for an event, or pulling revenue out of a purchase event, requires the upgrade.
WireBoard tracks custom events on every plan and lets you attach a numeric value (revenue per event) without a tier upgrade. Goals can break revenue down by event property value, for example revenue by plan tier on a SaaS sign-up. The same widgets and the same property-narrowing are available on the Free Plan as on Pro Plus.
For a SaaS counting sign-ups, a publisher counting subscriptions, or a shop counting orders, the cost of measuring revenue per event differs by tier on one product and not the other.
3. Segmentation and A/B testing via tags
Pirsch implements segmentation and A/B testing through its tag system. Both are listed on the features page as Plus-tier capabilities.
WireBoard ships a three-slot tag system (:tag1 / :tag2 / :tag3) plus custom event properties on every plan. Tag any event, attach arbitrary custom props to it, and slice every chart by tag or prop value in a click. Cross-filter by device, country, source, browser, OS, language or returning state from the same panel. None of it sits behind a higher tier.
If your day-to-day work is splitting traffic between variants, or chopping the dashboard by a custom dimension you defined, the same workflow costs $12/month on Pirsch and is included in WireBoard's entry plan.
Two product differences that have nothing to do with plan tiers
The unlock map is one layer. Below it are differences that hold no matter which Pirsch tier you compare against.
Real-time: streaming live widgets versus a refreshing dashboard
Pirsch describes its dashboard as real-time. The Pirsch documentation frames the live view through filters that include "the last hour" and a refresh action on the dashboard. That is a perfectly defensible design choice.
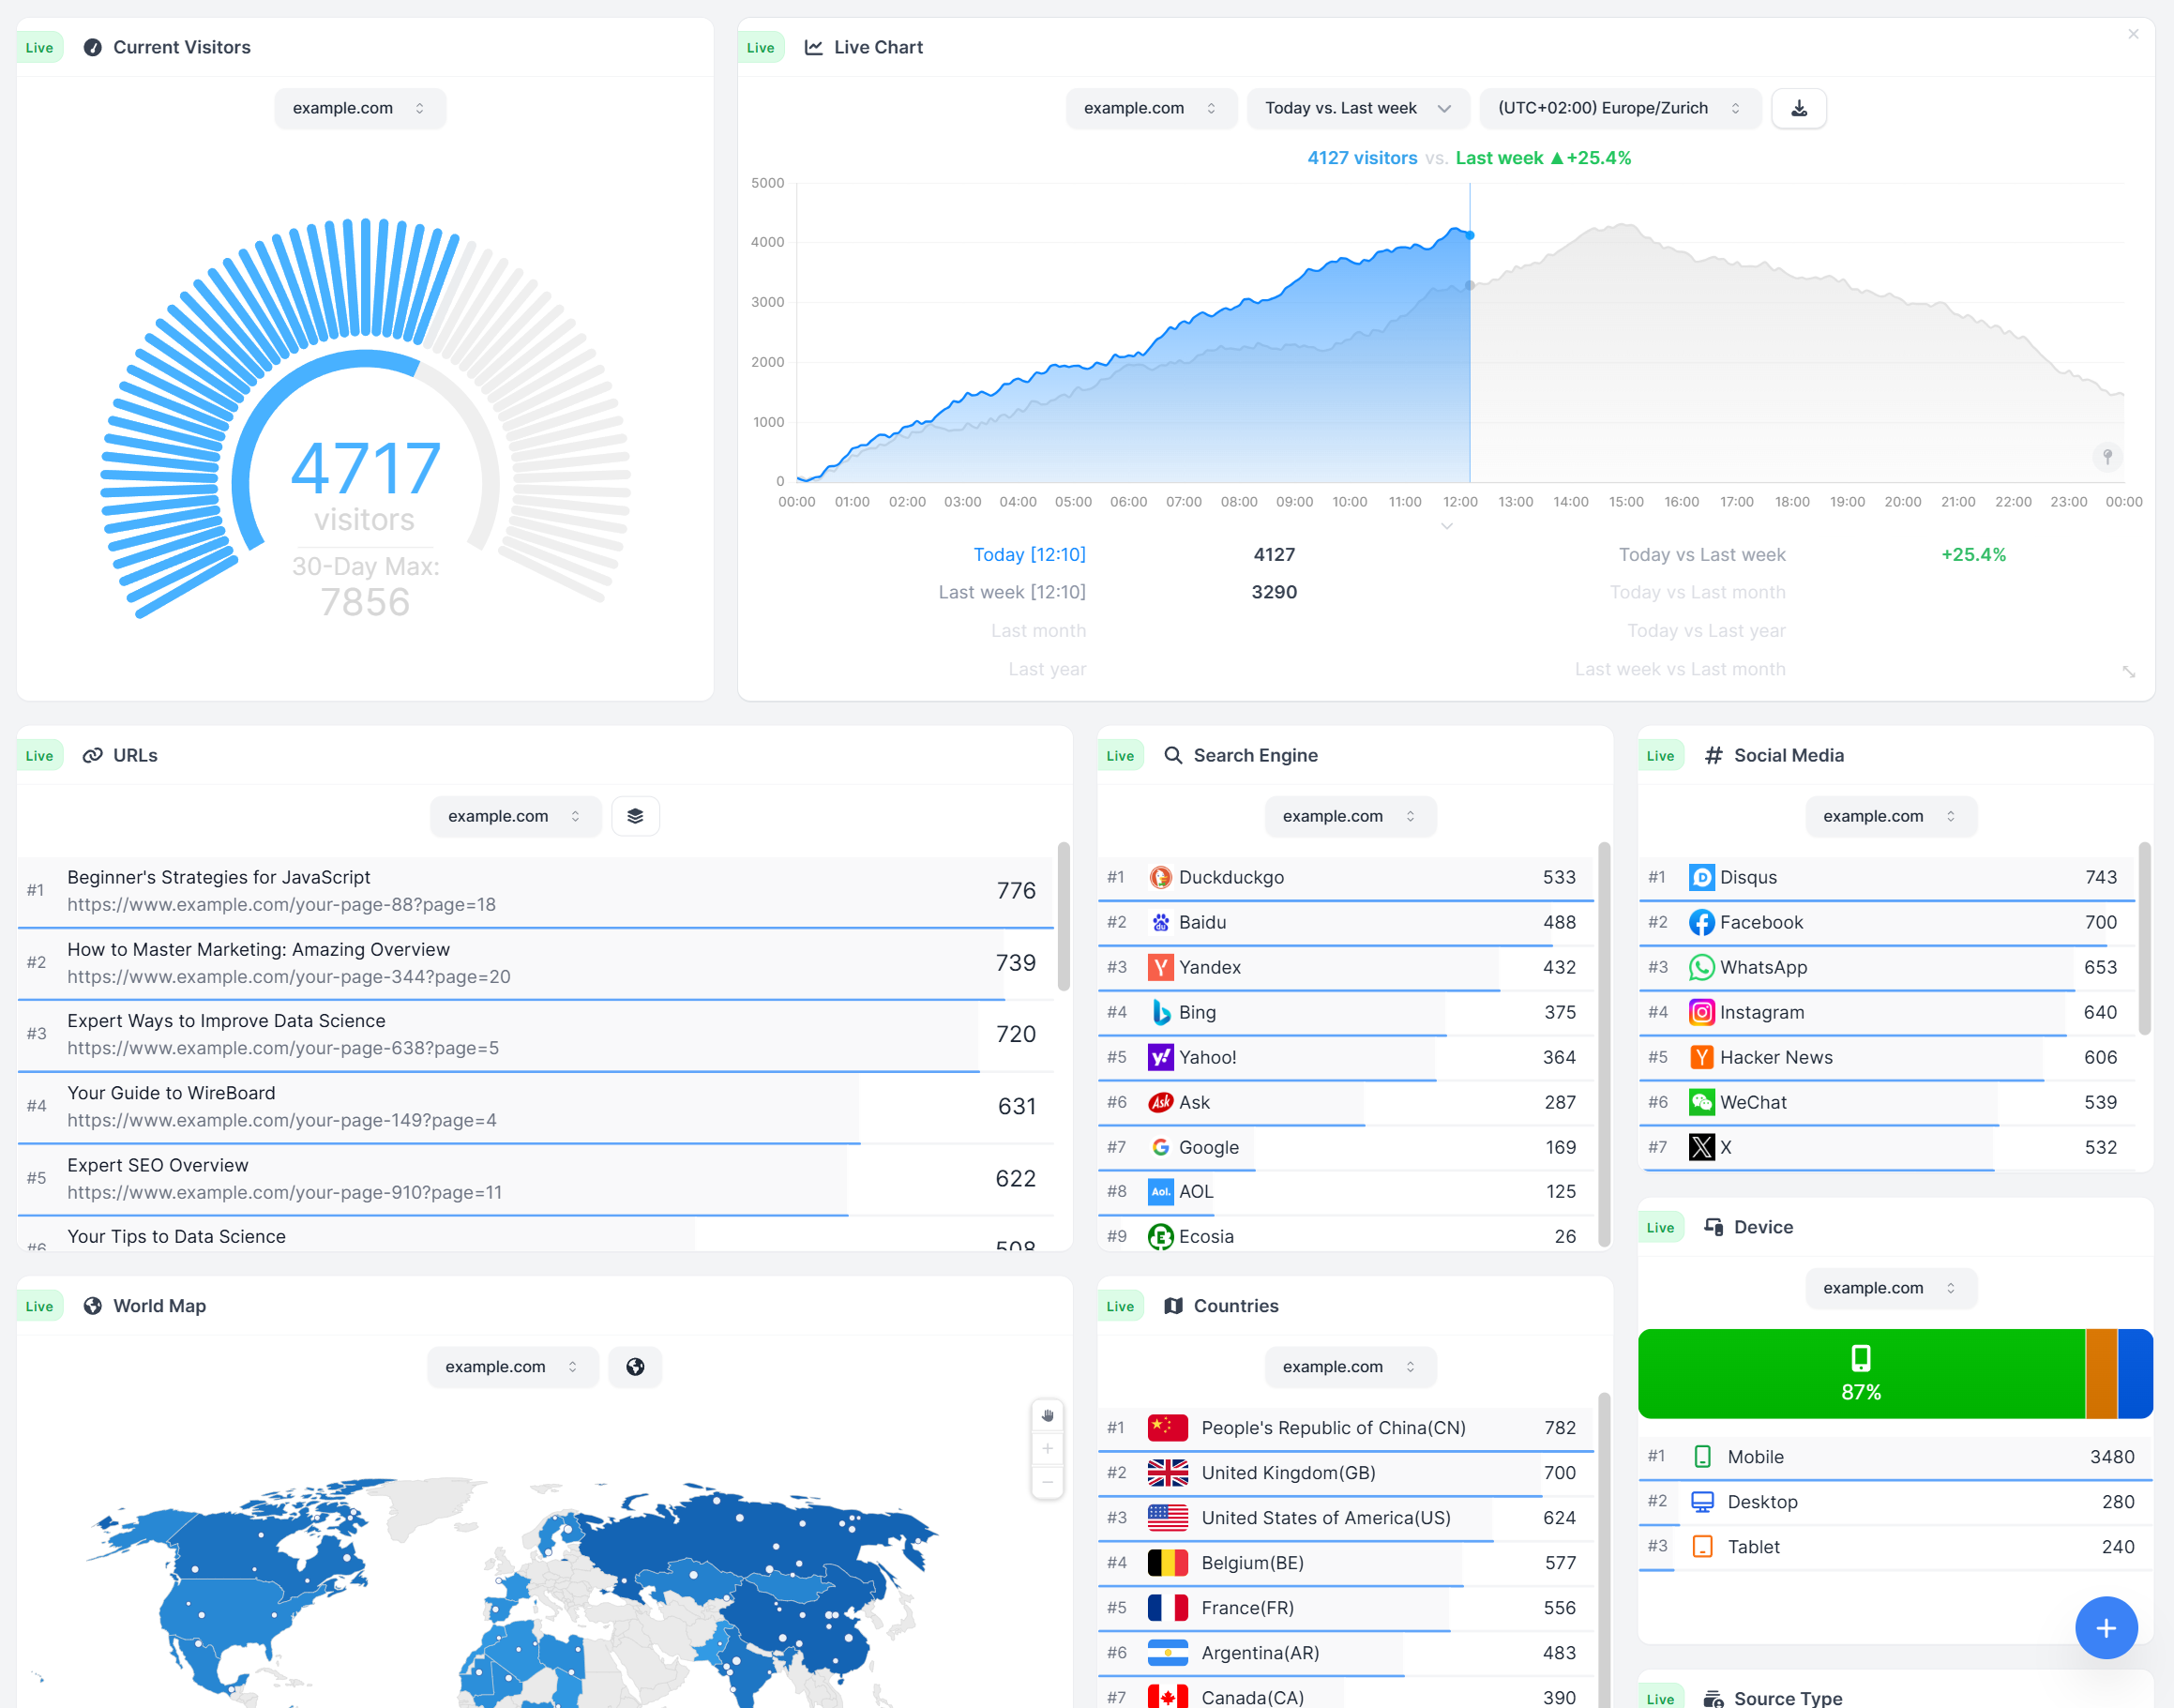
WireBoard's hero design is different. Two widgets lead the dashboard: a live counter of concurrent visitors on the site at this moment, and a live view of the URLs they are reading. Both update as visitors arrive and navigate from page to page. Around them, on the same board, sit the world map, the traffic-sources panel, the device-breakdown chart, real-time funnels with running drop-off, and the rest of the 20+ live widgets named on the WireBoard features page. Historical surfaces (date-range trends, period-vs-period comparisons, the URL Explorer, the visitor activity heatmap) work from stored data, the way any analytics history view does.
If you check the dashboard once a day, the difference is invisible. If you keep it open during a launch, a tweet, an ad burst or an algorithm-rumble morning, the streaming surface is what makes the tab worth watching.
Multi-site: live aggregation in one widget, or per-site dashboards
Pirsch lets you manage many sites under one account. Each site has its own dashboard, and Pirsch Plus adds Teams for multi-user management. What is not in their documentation is a single widget that aggregates live traffic across a chosen subset of your sites.
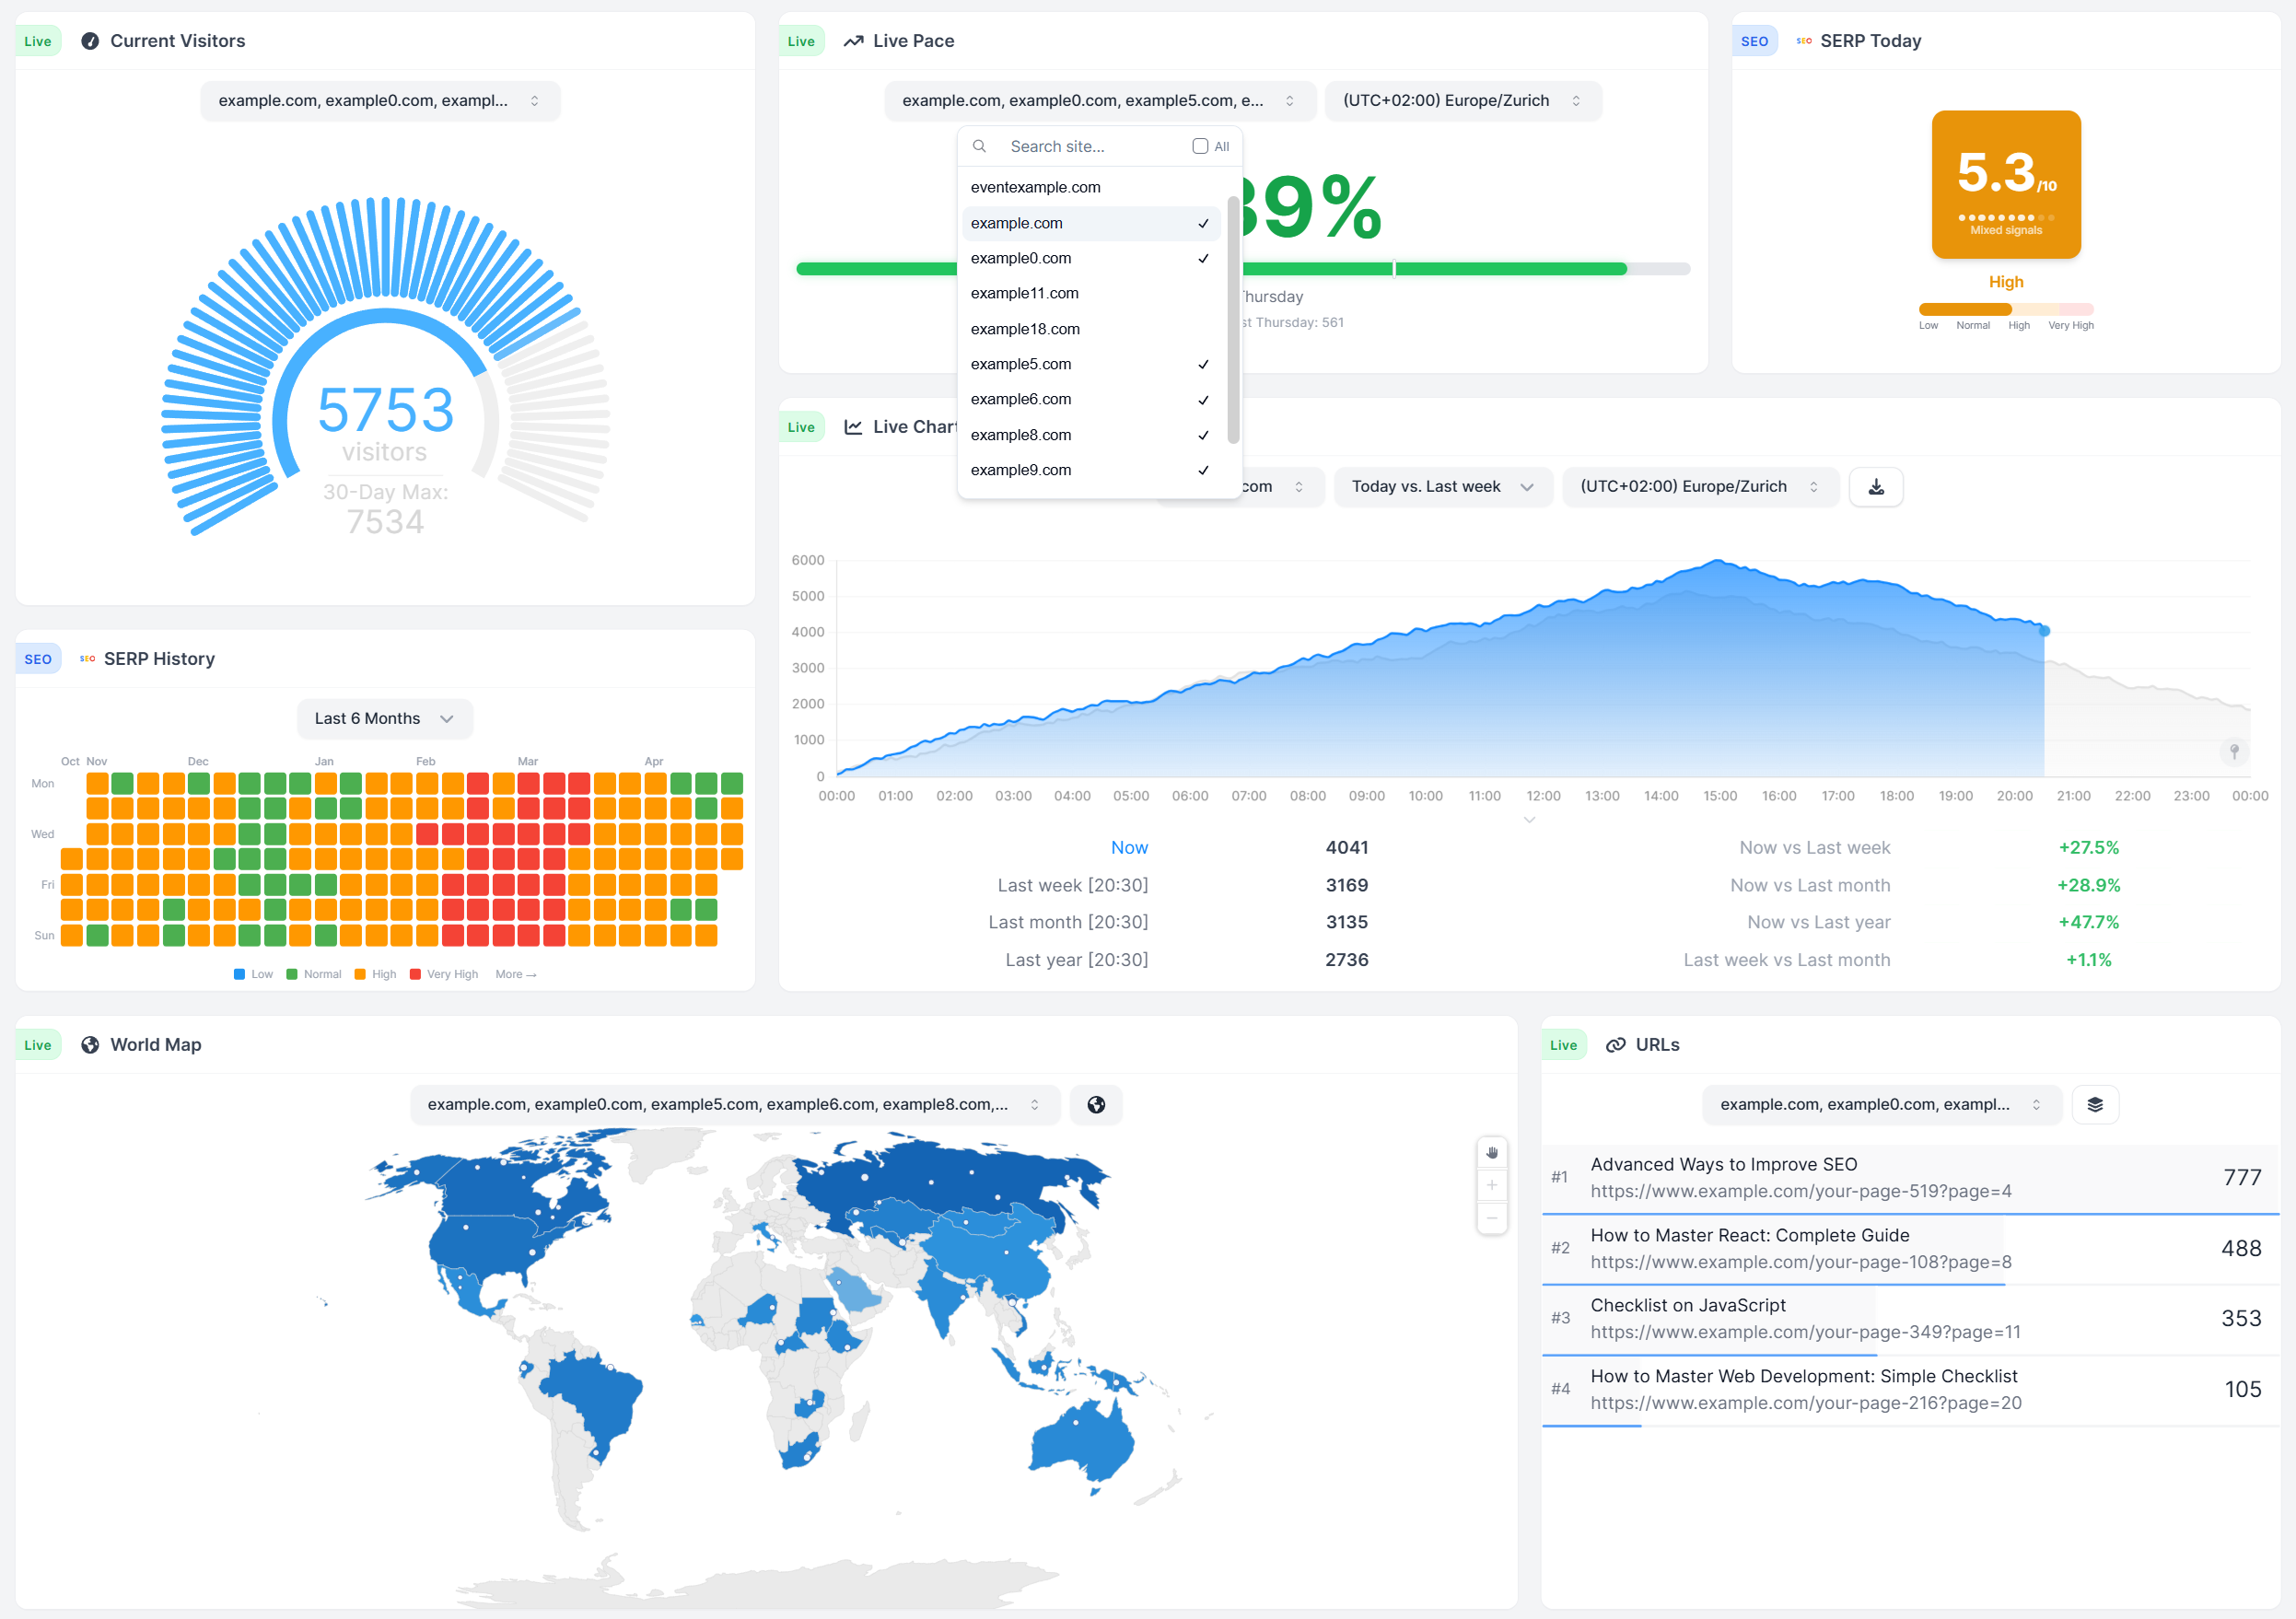
WireBoard takes a different route. Choose any combination of the sites under your account, and their live numbers stream into a single widget. The same component that handles one site handles ten. Embed tokens drop a live dashboard into a client portal. Streamer Mode hides your domains during screen shares. Three themes plus multiple boards per site let your client-facing layout differ from the one you keep open for internal operations.
For an agency on a Monday morning, a SaaS team with marketing sites split across regions or a publisher running a small network, "all my sites, one live widget" is the differentiator most reviews never test against.
Where Pirsch pulls ahead of WireBoard today
Four points where Pirsch has the better answer right now. If any of them are non-negotiable for your work, that is the signal to pick Pirsch.
A built-in URL shortener. Pirsch ships a URL shortener on every plan and an advanced version on Plus. It is a small feature, but if a single tool that hands you both the tracking and the shortened link is what your workflow needs, WireBoard does not currently include this.
Imports from Google Analytics, Plausible and Fathom on every plan. Pirsch's import paths let you carry historical data from three competing tools into the Pirsch dashboard. WireBoard currently does not ship GA, Plausible or Fathom imports.
An open-source core Go library. The Pirsch engine is published as an open-source Go library on GitHub. The SaaS dashboard is not open source, but if a self-hostable open-source engine from the same vendor is part of your decision, Pirsch has an answer that WireBoard does not.
Google Search Console integration. Pirsch connects to Google Search Console on every plan, pulling your keyword data into the analytics dashboard so it sits next to your traffic. WireBoard does not currently offer a GSC integration.
What WireBoard offers that Pirsch Analytics doesn't ship today
Flipping the question. Every line below is something WireBoard ships today, and not something I can find in Pirsch's public documentation.
Live, streaming widgets across the dashboard. A live concurrent-visitor counter that updates as people arrive and leave. A live view of which URLs are being read right now. Behind those: the world map of visitor countries, a live traffic-sources panel, a live device breakdown, real-time funnels with live drop-off, and the remaining widgets in the 20+ live set on the features page.
A dashboard you build, not one you receive. 60+ drag-and-drop widgets, multiple boards per site, three themes (Light, Dark, Future). A live operations board, a weekly review board, a client-facing board, side by side on the same site. The first board comes populated by a default template at sign-up, so you are not staring at an empty grid on day one.
Multi-site live aggregation in a single widget. Select any combination of the sites under your account and the live numbers from all of them combine into one streaming widget. The portfolio view and the single-site view share the same component. Embed tokens drop a live dashboard into a client portal.
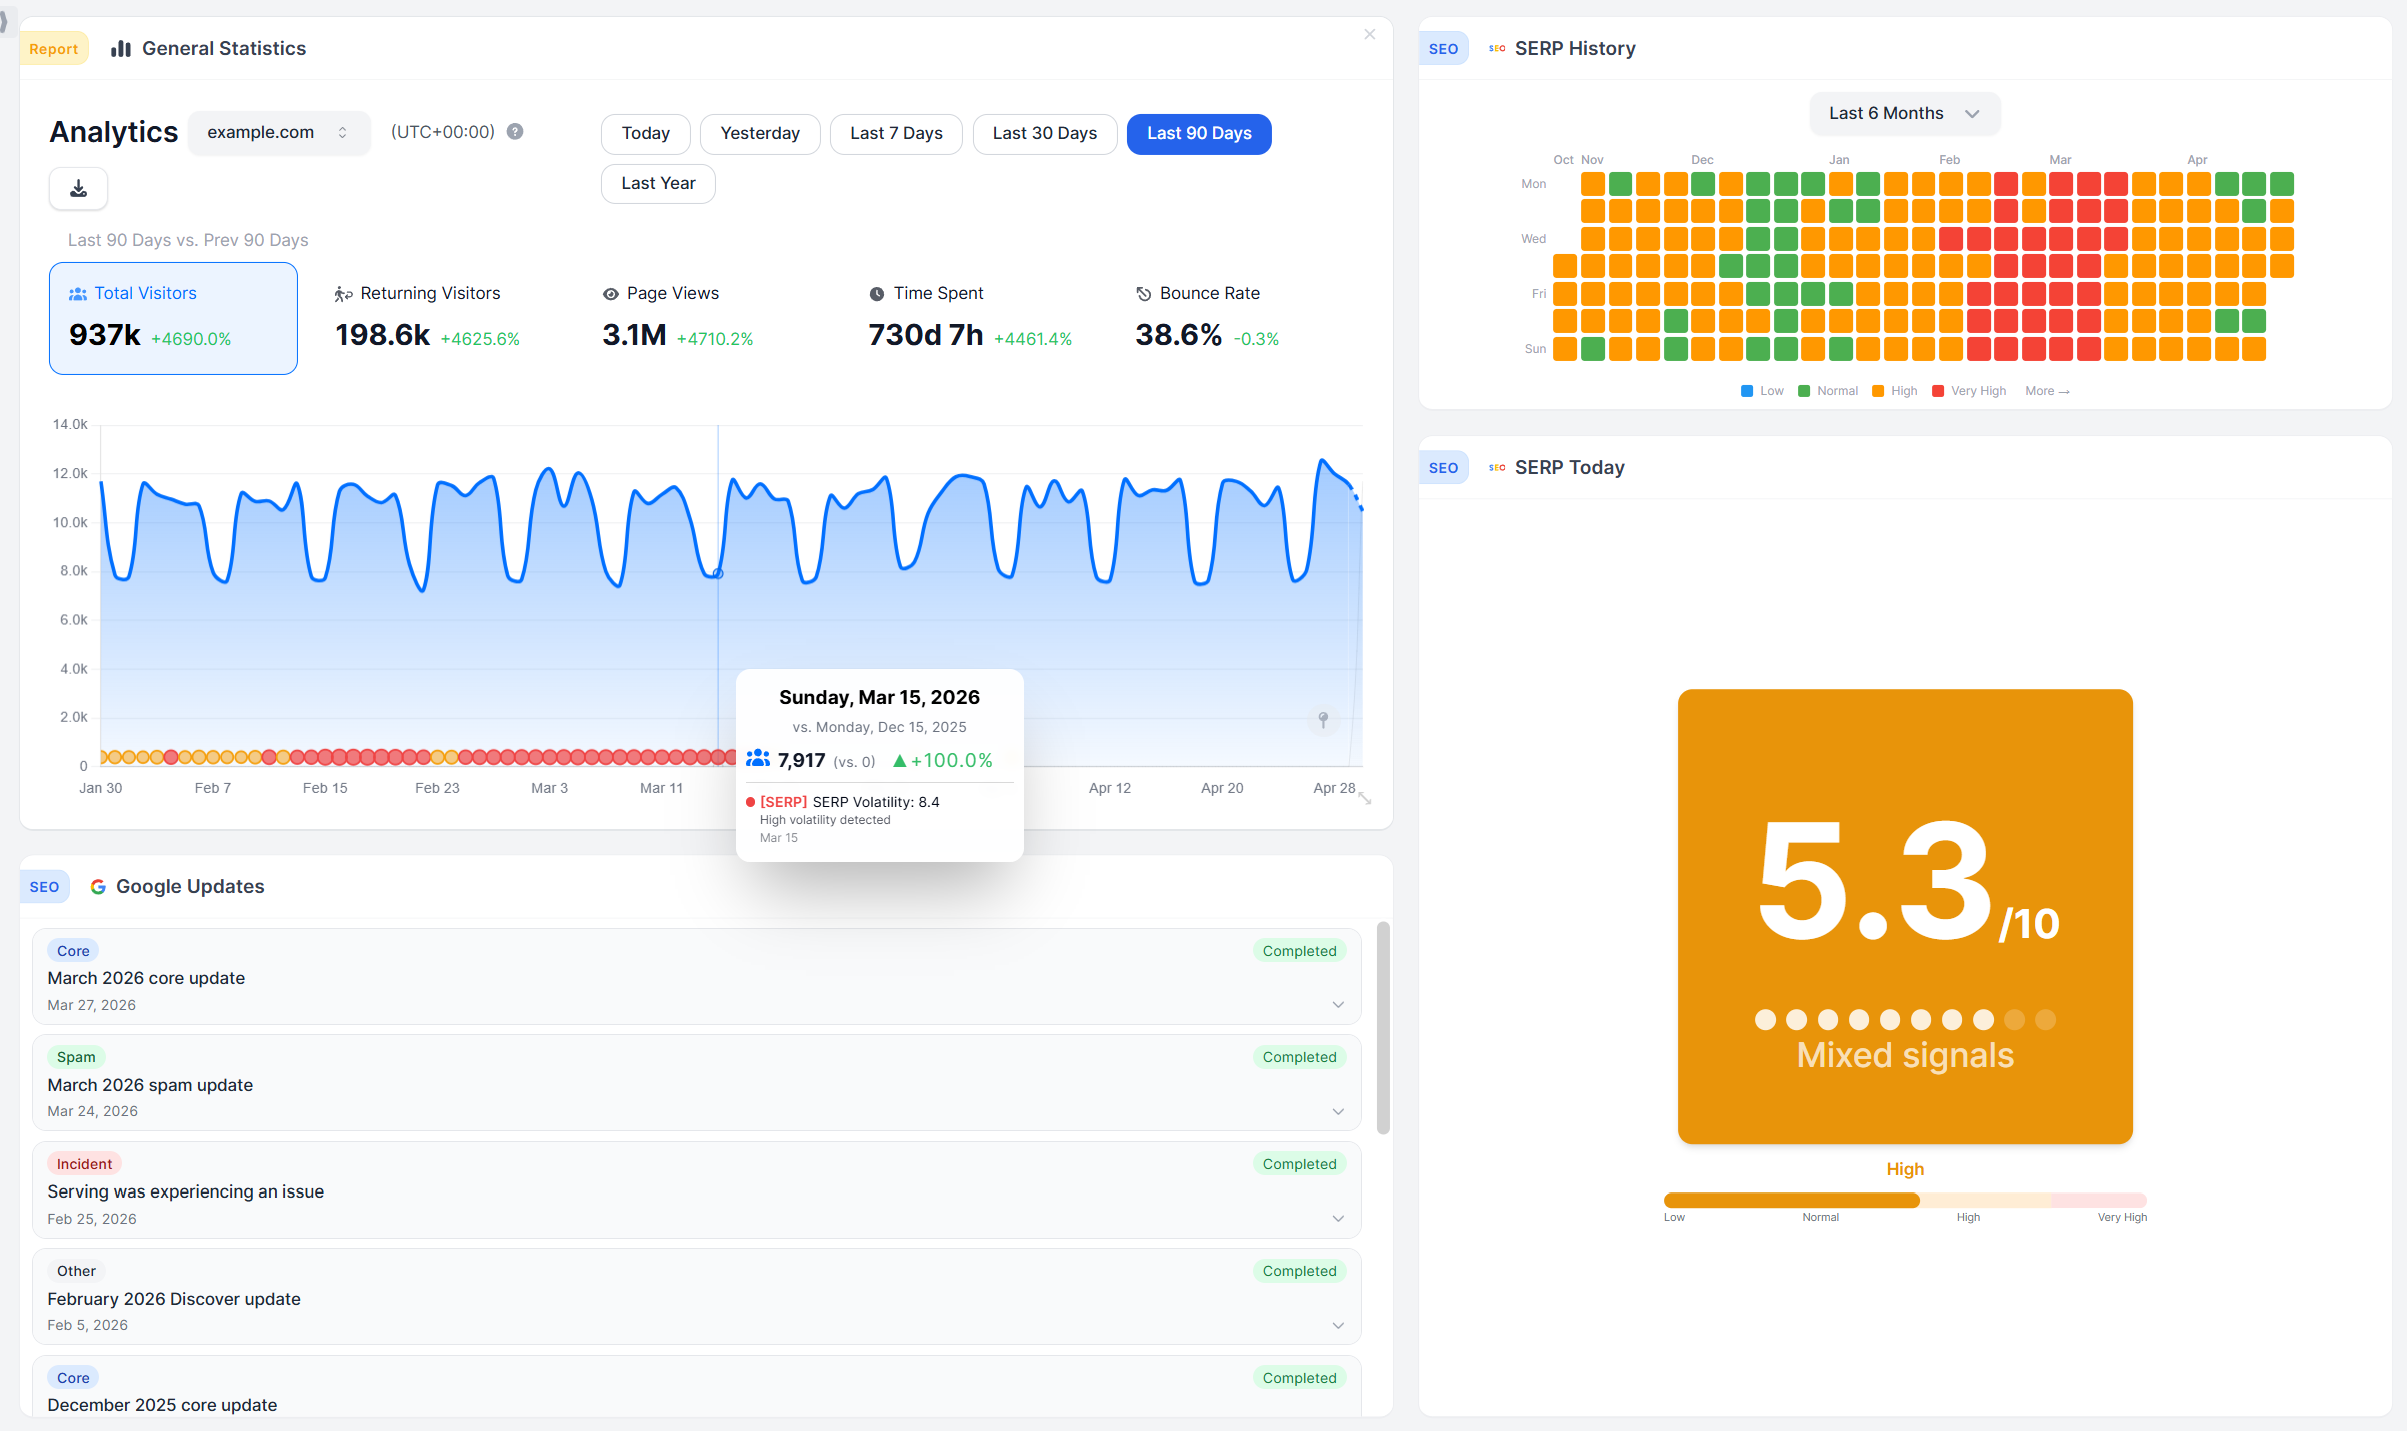
A built-in SEO suite for SERP turbulence and Google rollouts. WireBoard ships a live SERP Volatility score, a timeline of Google Core and Spam Updates, and a per-country holiday annotation layer that overlays onto any chart with a time axis. Nothing similar appears in Pirsch's public documentation.
Funnels and revenue tracking on the Free Plan. Both capabilities are shipped on the entry tier and the permanent free tier. Pirsch keeps both behind the $12/mo Plus upgrade.
Tag-based cross-filter slicing and custom event props on every plan. The three-slot tag system (:tag1 / :tag2 / :tag3) and arbitrary custom event properties slice any chart by any dimension you defined. The same workflow is a Plus-tier capability on Pirsch.
Annotations on every time-axis chart. Four built-in layers (your events, Google updates, SERP volatility, public holidays) sit alongside any per-user notes on charts with a time dimension.
A public API with a Live event stream and an MCP server. WireBoard ships a read-only REST API at api.wireboard.io plus a Live Server-Sent Events stream that pushes 20 categories of visitor activity the moment they change. Official SDKs for JavaScript/TypeScript (@wireboard/api) and Python (wireboard-api) wrap every endpoint, and an official MCP server (@wireboard/mcp) lets Claude, Cursor and other LLM agents query your analytics inline. Pirsch ships REST and SDKs; the live event stream and the MCP integration are WireBoard-only.
Streamer Mode for screen sharing and one-keystroke screenshot capture. Blurs your URLs, domains and page titles for client calls and demos. Shift+C grabs a PNG of any board.
A free plan that does not expire. The WireBoard Free Plan gives you 50,000 monthly pageviews, 2 websites, 3 boards, the full feature surface, and no credit card on file. Pirsch's equivalent is a 30-day trial; once the month is up, the meter starts.
If you're searching for a Pirsch Analytics alternative
Anyone who has hit the Pirsch Plus paywall knows what brought them here: funnels are Plus tier, revenue tracking is Plus tier, segmentation by tags is Plus tier, A/B testing via tags is Plus tier. WireBoard ships those four on every plan, including the permanent free one. WireBoard streams the live data too: visitor counter, world map, referrer panel, and event feed all update the moment a hit lands, on a board you compose with sixty-plus widgets and three themes.
Running several sites and reading them live? A multi-site widget aggregates the lot into one streaming view. Watching for a Google update? SERP volatility and the core-and-spam-update timeline are built into the same dashboard. Tracking conversions and revenue by plan tier? Goals do that with a trend chart, on every paid plan.
Pirsch still has things WireBoard does not today: one-click imports from Google Analytics, Plausible and Fathom; a built-in URL shortener; a Google Search Console integration; and a separate open-source Go library. (Both products now ship a read-only public API on the entry plan; WireBoard adds a Live SSE stream and an MCP server on top of REST.) If those Pirsch-only items are doing real work for you, Pirsch is the right call. If the Plus paywall is the friction, WireBoard is the Pirsch Analytics alternative without that paywall.
Should you trust this comparison?
Fair to ask.
I built WireBoard. I have spent time on Pirsch Analytics, walked through their pricing matrix, their features grid and their documentation, and watched a fair number of publishers and small teams weigh the same call. If Pirsch is the better fit for your situation, the post says so. If WireBoard is, the post says that too, and points at the receipt.
Verifiability. Every Pirsch statement in this post links to either their pricing page, their features matrix, their documentation, or their GitHub organization. The Sources block at the foot of the post is the index. WireBoard statements rest on the product itself; any item still on our roadmap (Slack-native reporting, configurable traffic-spike alerts) is flagged inline as a real gap rather than dressed up as a quiet edge.
Customer signal. WireBoard is used by publishers whose week involves watching traffic move, including Robert Farrington of The College Investor (personal finance publishing) and Barry Schwartz of Search Engine Roundtable, who covers Google algorithm activity daily. Their profile (a content publisher with conversion goals and the occasional traffic spike) is the same one that most often compares WireBoard with Pirsch.
How the pricing actually plays out
Prices below were recorded from each company's published pricing page in May 2026. Both Pirsch Analytics and WireBoard adjust pricing periodically. Before making a buying decision, verify current rates on the Pirsch Analytics pricing page and the WireBoard pricing page.
Pirsch prices through a pageview slider across three plans (Standard, Plus, Enterprise) with features differing by tier. WireBoard prices across nine pageview tiers (Free Plan through Enterprise) with every feature included on every plan.
Pirsch Analytics tiers (entry price at 10,000 pageviews per month)
Yearly billing offers a discount. There is no permanent free plan; the trial is 30 days.
Plan | Monthly | Websites | Funnels | Custom event metrics | Custom domains | Hosting |
|---|---|---|---|---|---|---|
Standard | $6 | 50 | No | No | No | Cloud (Germany) |
Plus | $12 | Unlimited | Yes | Yes | Yes | Cloud (Germany) |
Enterprise | Custom | Unlimited | Yes | Yes | Yes | Cloud or on-premise |
Prices scale with pageview volume through the slider on Pirsch's pricing page. Custom events and 10% of session-extension events count toward the monthly pageview limit, per Pirsch's pricing-page footnote.
WireBoard tiers
WireBoard ships nine plans starting at $0 forever. Yearly billing saves about 17%. Every paid tier and the Free Plan include every feature.
Plan | Monthly | Pageviews/mo | Sites | Dashboards | Team seats | History |
|---|---|---|---|---|---|---|
Free Plan | $0 | 50,000 | 2 | 3 | 1 | 30 days |
Micro | $9 | 100,000 | 50 | 100 | 3 | 3 years |
Small | $19 | 250,000 | 50 | 100 | 5 | 3 years |
Medium | $24 | 500,000 | 50 | 100 | 10 | 3 years |
Large | $49 | 1,000,000 | 50 | 100 | 15 | 3 years |
Extra Large | $99 | 3,000,000 | 50 | 100 | 20 | 3 years |
Pro | $199 | 6,000,000 | 50 | 100 | 30 | 3 years |
Pro Plus | $399 | 12,000,000 | 100 | 200 | 50 | 3 years |
Enterprise | Custom | Custom | Unlimited | Unlimited | Unlimited | Custom |
Same need, side by side: the funnel-included plan
Funnels are the cleanest unlock comparison because Pirsch gates them to Plus and WireBoard ships them on every plan. The table below compares the cheapest plan on each product that includes funnels, at the lowest published pageview tier.
What you get | WireBoard | Pirsch Analytics |
|---|---|---|
Cheapest plan with funnels | Free Plan: $0/mo | Plus: $12/mo at 10k PV |
Cheapest paid plan with funnels | Micro: $9/mo at 100k PV | Plus: $12/mo at 10k PV |
Cheapest plan with revenue tracking | Free Plan: $0/mo | Plus: $12/mo |
Cheapest plan with segmentation | Free Plan: $0/mo | Plus: $12/mo |
Both products count any tracked hit toward the monthly quota: pageviews and custom events alike. WireBoard labels its quota "page views" and Pirsch labels its quota "page views, events, and 10% of session extensions," but the underlying hit counting is the same shape.
Three pricing facts that shape the decision
WireBoard ships funnels, revenue tracking and segmentation on every plan, free included. Pirsch ships them on Plus only. If any of those three matter to your work, the day-one cost differs by $12 a month.
WireBoard has a permanent free plan; Pirsch does not. The WireBoard Free Plan gives you 50,000 monthly pageviews, two sites, three dashboards, the entire feature surface, with no card and no expiry. Pirsch runs a 30-day free trial; after that, the meter turns on.
At very high volumes, Pirsch can be lower-cost per pageview, but the comparable Pirsch tier still needs Plus to match WireBoard's included feature set. Whether that trade-off favors WireBoard or Pirsch depends on whether you weigh per-pageview rate or feature-per-dollar more heavily.
See for yourself. Put both on a real site.
Reading is the slow path to this decision. The faster path is to put both products on a site you already operate and use them on the work you would have done anyway.
Pirsch ships a 30-day trial. WireBoard's Free Plan stays free as long as you stay under 50,000 monthly pageviews. Add both script tags to one site, let regular visits flow, and look at each dashboard the way you would look at any analytics tab.
Sit them next to each other. Two browser windows, two dashboards, one site. Refresh, navigate, scroll. Decide which one you would actually leave open.
Build the gated feature on both. Set up a funnel on Pirsch and on WireBoard. Tag an event with a revenue value on both. Cut a chart by a custom tag on both. Notice which actions are possible on the entry plan and which are not.
Use it for a real question. Pick something concrete. The country your last newsletter sent visitors from. The drop-off step in your sign-up. Which client site moved most this week. Whichever dashboard answers the question first is the dashboard worth keeping.
Pros and cons at a glance
WireBoard | Pirsch Analytics | |
|---|---|---|
+ | ✅ True real-time, streaming live | ✅ Public REST API on every plan |
− | ❌ No GA / Plausible / Fathom import | ❌ Funnels limited to Plus |
The bottom line
Pirsch Analytics is the right pick if you need an on-premise deployment: Pirsch offers it on its Enterprise tier, and WireBoard does not currently offer one.
For everyone else, WireBoard is the call. Streaming live widgets the second a visitor lands. Sixty-plus drag-and-drop widgets and as many boards per site as you need, with a populated default template waiting on day one. Cross-site live traffic merged into a single widget. SERP volatility and Google algorithm tracking sitting next to your visitor charts. Funnels, revenue tracking and tag slicing on every plan including free. No upgrade gate between you and the features that actually inform a decision.
Start tracking for free with WireBoard. 50,000 pageviews per month, 2 websites, 3 dashboards, every feature included. No credit card. No trial period. No catch.
Sources
WireBoard
Pirsch Analytics (where the claims about their product are grounded)
EU data protection and infrastructure