

Which should you pick: WireBoard or Simple Analytics?
WireBoard and Simple Analytics are both EU-built web analytics platforms that grew up as alternatives to Google Analytics. Both are paid SaaS products. Both market themselves as GDPR-friendly. The two products do not, however, answer the same brief.
Pick Simple Analytics if you want the smallest possible dashboard footprint, if your team reads traffic through a Looker Studio / Power BI connector, or if you want a native iOS app on your phone.
Pick WireBoard if you watch traffic live during launches and Google update days, if you build the dashboard around how you actually work, if you operate more than one site and want them aggregated in a single live widget, if you track SERP volatility alongside your visitors, or if you would rather pay one price and have every feature unlocked.
Below: a scoreboard, five buyer questions answered side by side, where each product is the stronger pick, the pricing tables at every volume, and a short plan for trying both.
At a glance
| WireBoard | Simple Analytics | |
|---|---|---|
| Real-time | Streaming live widgets, real-time funnels, live event feed | Not described as real-time on the public site |
| Dashboards | 60+ widgets, drag-and-drop, multiple per site, three themes | One dashboard per site, fixed layout |
| Multi-site live aggregation | Yes, in a single widget | Not offered |
| SEO suite (SERP volatility, Google updates) | Included on every plan | Not offered |
| Funnels | Real-time funnels with flexible step order, every plan | Goals + Events Explorer pairing |
| Custom events | Every plan, including free | Every paid plan |
| Goals + revenue tracking | Every plan, including free | Simple plan ($15+) and up |
| Free plan | Permanent, every feature, 50,000 PV/mo | Permanent, 20,000 PV/mo, 30-day history |
| Price for 1M pageviews/mo (full features) | $49/mo (Large, every feature) | $60/mo Simple plan, $120/mo Team plan |
| Read-only public API | REST + Live SSE stream, official JS and Python SDKs, MCP server for LLM agents. REST on every plan (Free capped at 30 days history); Live API on paid plans only | REST stats API + raw-data export, Looker Studio connector |
| AI chat with your analytics | Yes, via official MCP server in Claude Desktop, Cursor, etc. | Yes, built into the dashboard |
| Native iOS app | Not offered | Yes, today |
| Looker Studio + Power BI integrations | Not offered | Yes, today |
| Open source / self-hosting | No | No |
| Cookieless mode | Optional toggle, off by default for accuracy | Always on, no toggle |
| EU-hosted | Yes, full pipeline in-house | Yes, on Dutch servers |
The shared ground both products stand on
Most reviews of these two tools spend their first 500 words on privacy. Both products earn that conversation. Both are EU-based, both market themselves as a clean exit from Google Analytics 4, and both let you avoid sending your visitor data into the United States after multiple EU data protection authorities ruled GA4 non-compliant with GDPR. On the privacy axis, picking between WireBoard and Simple Analytics is picking between two right answers.
Simple Analytics positions its product as cookieless and consent-banner-free. That is their marketing claim, and your legal team should evaluate it on its own terms. WireBoard runs cookies on by default for accuracy, with a one-switch cookieless mode under Legitimate Interest available when you want the same banner-free posture.
The split between the two products is not at the privacy line. It is at the dashboard, the depth, and what each tool wants to be once you log in. The next section walks through five questions a buyer actually asks at evaluation time, and how each tool answers them.
Five questions buyers actually ask
I run WireBoard. I have read Simple Analytics' docs and pricing page more times than is reasonable, and I have talked to people who picked them over us. The five questions below are the ones that come up in those conversations. Each one is the same comparison through a different lens.
1. "Is something happening on my site right now?"
Simple Analytics does not market itself as a real-time tool on its public site. The homepage and feature copy do not promise live visitor tracking, and the docs sidebar does not include a dedicated real-time or live-visitors page. The closest thing you will find is the iOS-app section, which talks about seeing spikes when you check your phone. That is consistent with the product they have built: a clean, periodic-snapshot view of your traffic that you check, not a live stream you watch.
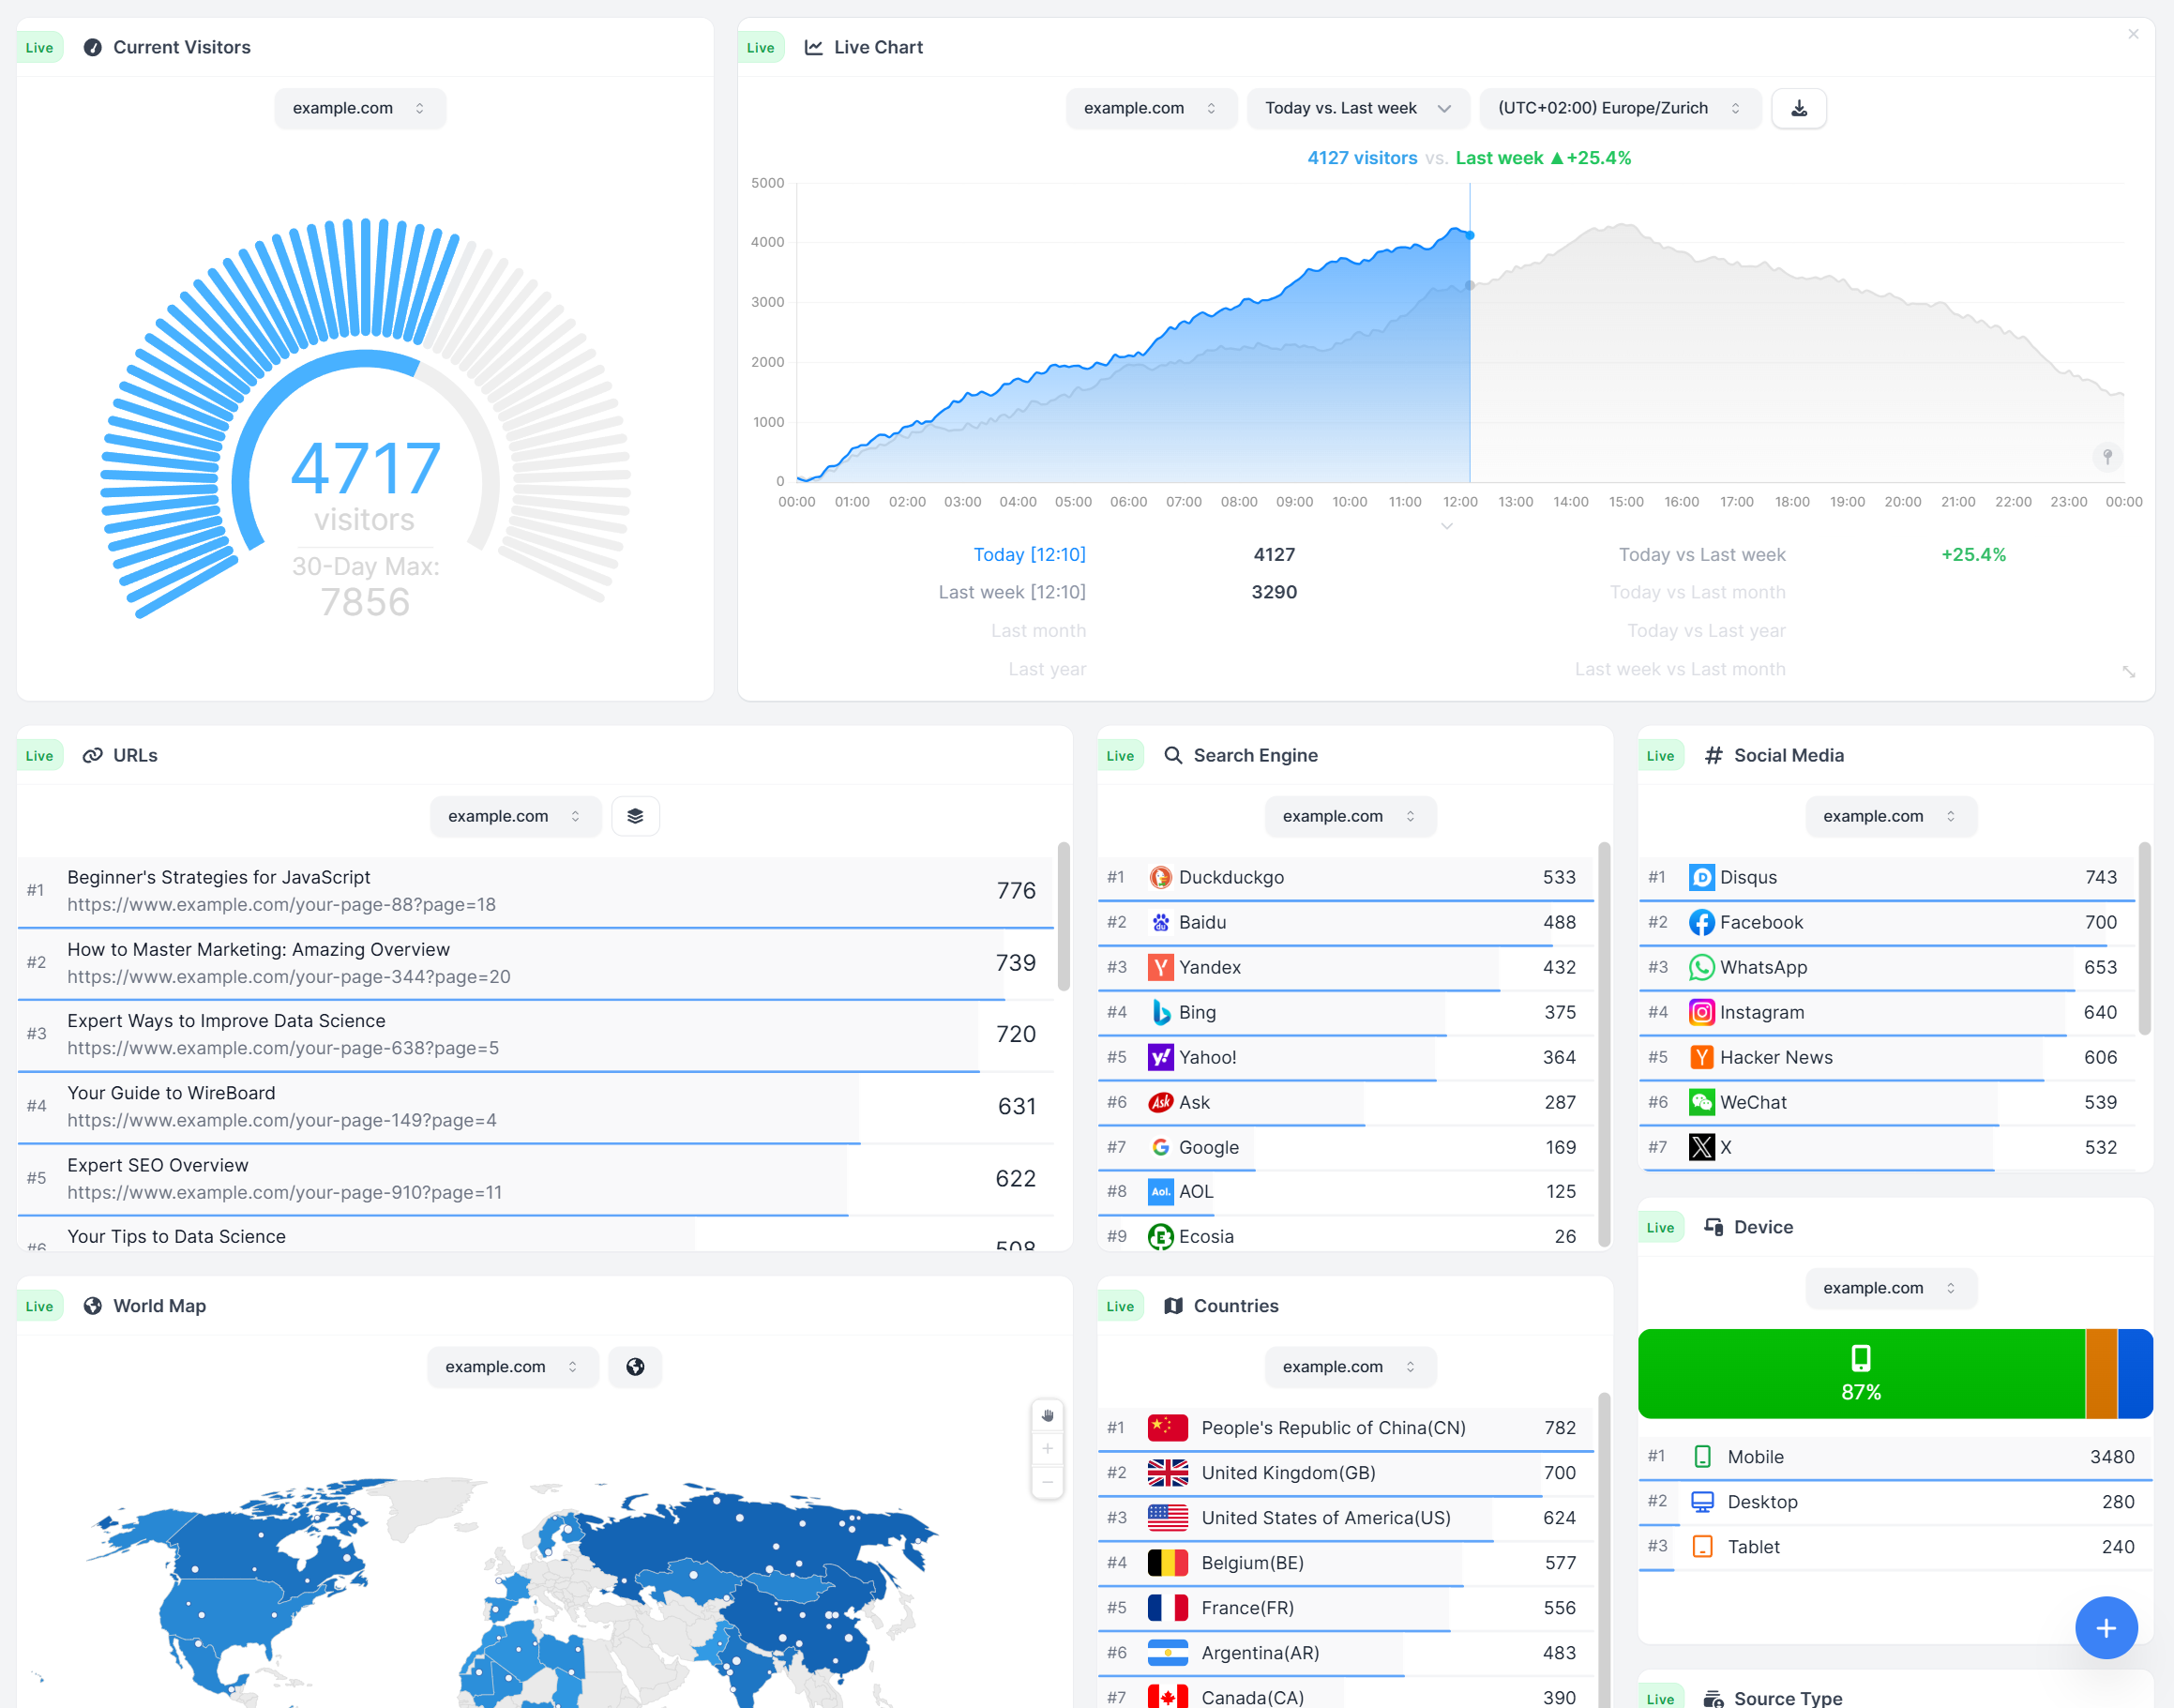
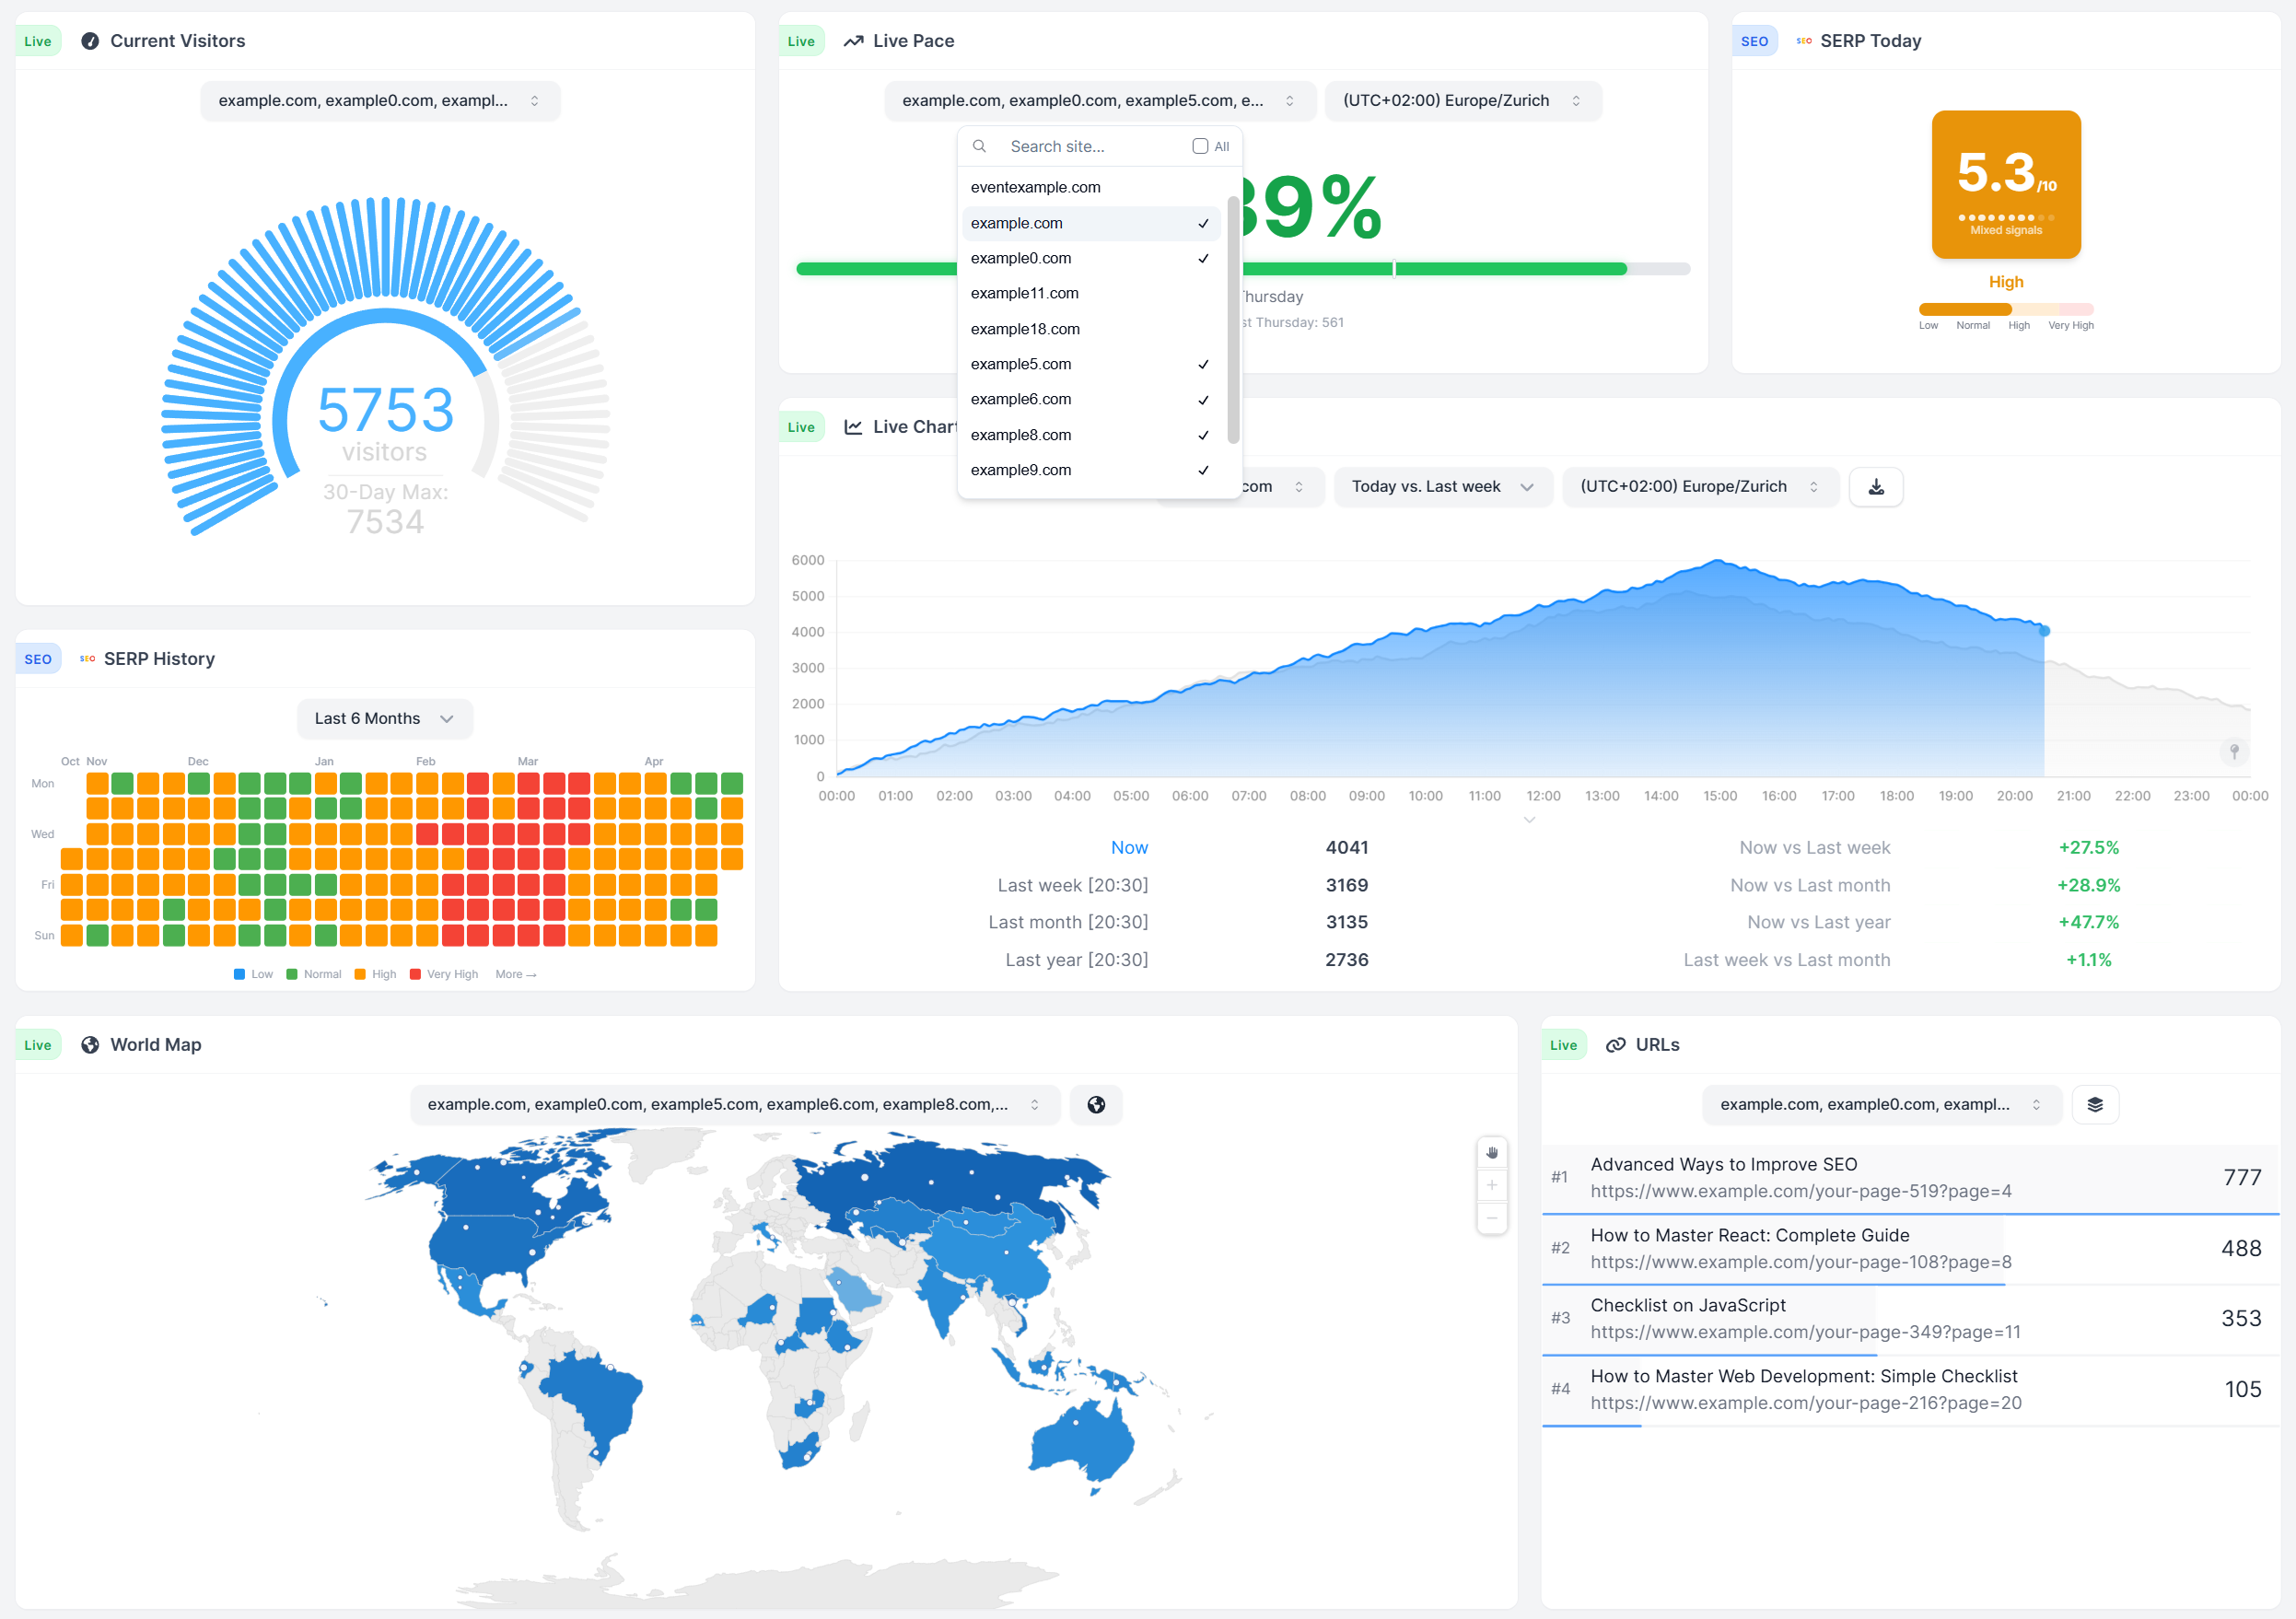
WireBoard is built around the opposite call. Two hero widgets sit at the top of the live dashboard: a live count of concurrent visitors right now, and a live view of which pages those visitors are reading. Behind them, the world map, traffic sources, device breakdown, and real-time funnels are part of the 20+ live widgets that update as events arrive. Historical reports compute over stored data and behave the way any analytics history view does.
If you check analytics once a week before a status meeting, this difference is academic. If you ship launches, run flash sales, or open the dashboard the morning of a Google algorithm rollout, the difference between "what was true a few minutes ago" and "what is happening right now" stops being academic immediately.
2. "Can the dashboard look like the work I do?"
Simple Analytics ships one dashboard per site, with a fixed layout. That is a design choice, not a limit. Anyone who has seen one Simple Analytics dashboard can read another in twenty seconds, and there is nothing to misconfigure. The Team plan adds Custom views, which let you save filtered slices, but the underlying canvas is still the same single dashboard.
WireBoard hands you a populated dashboard from a sensible default template the moment you sign up, then steps out of the way. Drop a live world map next to a UTM funnel and a custom-event feed. Build a separate operations board for monitoring, a weekly review board for stakeholders, and a client-facing board for demos. Pick Light, Dark, or Future as the theme. Multiple dashboards per site, a deep widget library, drag-and-drop layout. The default is the floor, not the ceiling.
The deeper version of this question is who owns the layout, the tool or you. Simple Analytics answers "the tool, on your behalf, deliberately small." WireBoard hands you a working dashboard and the keys, then lets you decide whether to keep them.
3. "What about my whole portfolio of sites?"
Simple Analytics scales by adding sites to your account: 5 on the Free plan, 10 on Simple, 20 on Team. Each site has its own dashboard. There is no live aggregation widget that combines several sites into a single live view.
WireBoard is built around the portfolio case from the ground up. Aggregate any selection of your sites into one widget, with the same widget working for one site or many. Per-graph or per-site timezones. IP filtering across the whole account to remove your own team's traffic. For agencies, multi-brand operators, and anyone running more than two or three sites, this is the single biggest functional gap between the two products.
4. "Does it tell me when Google moves?"
Simple Analytics does not ship an SEO suite. There is no SERP volatility tracker, no Google update timeline, no per-country holiday overlay on time charts. That fits the product they have built: traffic in, traffic out, kept clean.
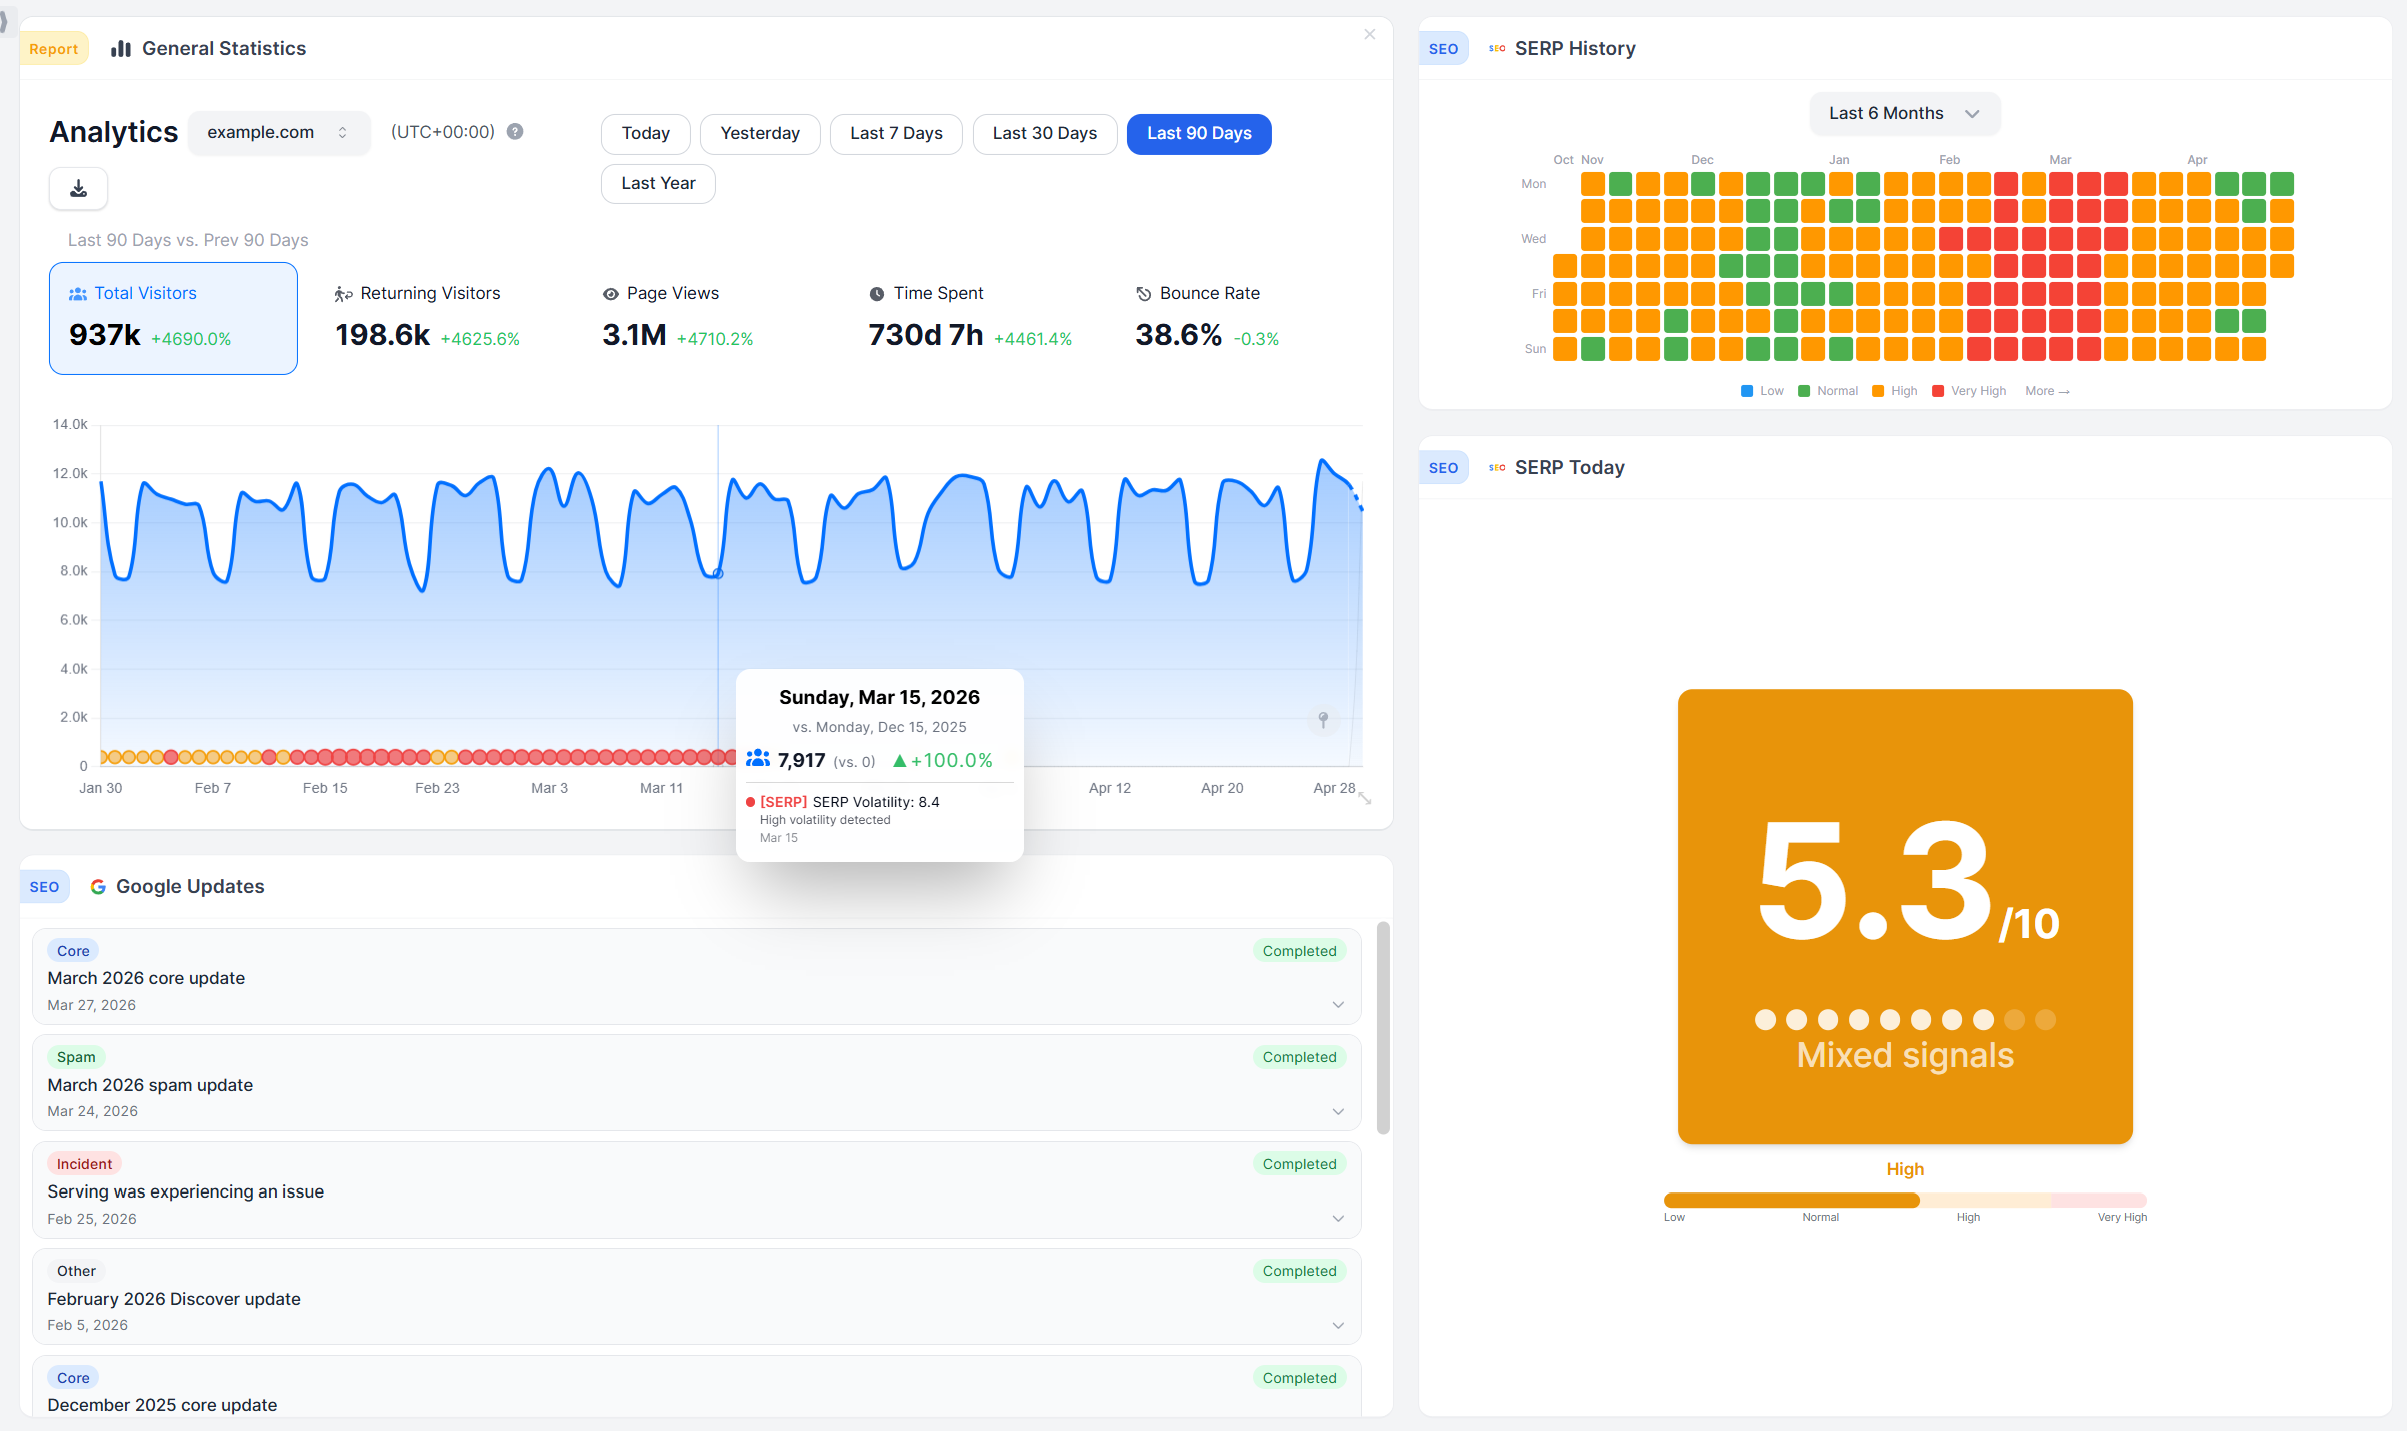
WireBoard ships SERP volatility tracking as a live dashboard, a timeline of Google Core and Spam Updates, and a holiday-annotation layer that drops per-country public holidays onto every time-axis chart. On algorithm-rollout days, having traffic, ranking turbulence, and the update timeline in one screen turns "is something happening" into a glanceable answer instead of a tab-hopping puzzle.
5. "What comes in the box, and what costs extra?"
WireBoard puts every feature on every plan, including free. Funnels, revenue tracking, custom events with properties, multi-site aggregation, the SEO suite, embed tokens, Streamer Mode, scheduled exports: the same product on every tier. The public API is read-only in v1 and split into two surfaces — a REST API for historical reports (account, sites, aggregate, timeseries, breakdowns, URL explorer, custom events) and a Live Server-Sent Events stream for real-time visitor activity. Both ship with official JS (@wireboard/api) and Python (wireboard-api) SDKs and an MCP server (@wireboard/mcp) for Claude Desktop, Cursor, and other LLM agents. The REST API is on every plan, with the Free tier capped at 30 days of history; the Live API is paid-plan only. Quotas (pageviews, sites, dashboards, team seats, history depth) scale with price; the feature set does not.
Simple Analytics gates a smaller set of capabilities behind tiers. Goals, events, trendlines, annotations and the read-only public API are on the Simple plan ($15+/mo) and up. Multiple users, custom views, role-based access, raw-data export, ad-blocker bypass, and IP range blocking sit on the Team plan ($40+/mo). Their gating is lighter than enterprise-class tools, but it is still a real ladder for buyers who shortlist on capability.
The shape of the buying decision follows: with Simple Analytics, you grow into the product as you need each feature. With WireBoard, you have the whole product on day one and pay for volume.
What Simple Analytics does better than WireBoard today
Three places where Simple Analytics has shipped capabilities WireBoard hasn't. If any of these is on your shortlist of must-haves, the choice is theirs. They are a thoughtful product team, and the gaps below are real.
Native iOS app. Simple Analytics has a native iOS app and home-screen widgets. WireBoard's dashboards are web-based, mobile-responsive, and embed nicely, but there is no first-party iOS app. If checking traffic from your phone is part of your daily routine, it matters.
Looker Studio and Power BI integrations. Simple Analytics publishes connectors and guides for Looker Studio and Power BI. WireBoard supports CSV / JSON / XLS / XLSX / ODS exports plus scheduled S3 / FTP / SFTP delivery, but does not currently ship dedicated Looker Studio or Power BI connectors.
Brand maturity. Simple Analytics has been in market for several years and has a sizable installed base of small-business and indie customers. WireBoard is newer in this category. If "size of the installed base I can talk to in public forums" is a tiebreaker, Simple Analytics has more public footprint today.
What WireBoard offers that Simple Analytics doesn't
The inverse list, kept to capability gaps visible on both products' public pages.
Streaming live widgets. The live visitor counter, the live view of which pages are being read, the world map, traffic sources, device breakdown, the live event feed, and real-time funnels all update as events arrive. Simple Analytics does not market a live, streaming view of any of these on its public site.
Live multi-site aggregation in one widget. Pick any subset of the sites in your account, and the same live widget that visualizes one of them visualizes all of them as a single stream. Agencies and multi-brand operators frequently land on WireBoard because of this one capability.
SERP volatility, Google update timeline, holiday overlay. The full SEO suite ships on every WireBoard plan, including free. Simple Analytics ships nothing in this category.
Drag-and-drop widget library, multiple dashboards per site, three themes. Simple Analytics gives you one fixed dashboard per site.
Real-time funnels, every plan, flexible step order. Build funnels that mix sessions, pageviews and custom events in any order. Simple Analytics pairs Goals with the Events Explorer for similar work, but does not ship a dedicated real-time funnel builder.
Annotations layer with four built-in tracks. My Events, Google Updates, SERP Volatility, and Public Holidays, plus per-user notes on every time-axis chart. Simple Analytics ships annotations too, but at narrower scope.
Streamer Mode and screenshot capture. Blur your domains, URLs, and titles for screen sharing and demos; press Shift+C to save a PNG of any dashboard.
Goals with revenue per event property. Track revenue by plan tier, country, source, or campaign, on every WireBoard plan including free. Simple Analytics' Goals start on the Simple plan.
Per-graph or per-site timezone. Useful if you operate sites in different markets and want each report read in local time.
Live event stream over Server-Sent Events. Both products ship a public read API. Simple Analytics' is a REST stats endpoint plus raw-data export. WireBoard's public API pairs a REST surface (account, sites, aggregate, timeseries, breakdowns, URL explorer, custom events) with a Live SSE stream that pushes 20 categories of visitor activity as they happen, plus official @wireboard/api (JS/TS/Node) and wireboard-api (Python) SDKs and an @wireboard/mcp server you can drop into Claude Desktop or Cursor to query your analytics from an LLM. If you are integrating analytics into your own product or agent stack, the Live stream and the MCP server are the gap.
Outgrowing Simple Analytics: WireBoard as the alternative
Searches for "Simple Analytics alternative" usually come from teams who have outgrown the single fixed dashboard page. WireBoard's first move is live: the visitor counter, the world map, the referrer panel, and the event feed all advance the moment a hit lands. Around that, sixty-plus drag-and-drop widgets, multiple boards per site, three themes, and a populated default template the minute you sign up.
Running a second and third site? One live widget rolls them all into one streaming view, not per-site cards on a separate page. Tracking real-time funnels and revenue per goal? On every plan, even the permanent free one. Watching for a Google update? SERP volatility and the core-and-spam-update timeline sit right next to your traffic.
What Simple Analytics offers today that WireBoard does not: a native iOS app. For everything else, WireBoard includes every feature on every plan, with the permanent Free Plan covering 50,000 pageviews on two sites and three boards. When Simple Analytics' single page is not enough, WireBoard takes over with a deeper canvas and multiple composable dashboards.
Should you trust this comparison?
I run WireBoard. I have used Simple Analytics, talked to people who picked it over us, and read their docs and pricing page until the sentences started repeating. This is the comparison I would write for a friend asking me how the two products actually differ. Where Simple Analytics is the better fit, I will tell you. Where WireBoard is the better fit, I will tell you that, with sources.
Two more things worth weighing.
Verifiability. Every Simple Analytics claim in this post traces to their public docs, pricing page, or homepage, with the links sitting at the bottom. WireBoard claims trace to product that ships today. Where a feature is on our roadmap rather than in the product (native iOS app, Looker Studio and Power BI connectors), I have flagged it as such where it appears.
Customer signal. WireBoard is used by people whose work makes "the last few minutes" the wrong unit of measurement, including Barry Schwartz at Search Engine Roundtable, who reports on Google algorithm updates daily and wants traffic and SERP volatility in the same dashboard. He did not arrive here because Simple Analytics was hard to find. He chose WireBoard because the workload reads differently when the dashboard is live. If your week resembles his, that observation matters more than the maker's pitch.
How the pricing actually plays out
Prices below were recorded from each company's published pricing page in May 2026. Both Simple Analytics and WireBoard adjust pricing periodically. Before making a buying decision, verify current rates on the Simple Analytics pricing page and the WireBoard pricing page.
The two pricing pages encode two different product philosophies. Simple Analytics charges by datapoint volume and unlocks a small set of capabilities as you climb tiers. WireBoard charges by usage volume across a handful of quotas (pageviews, sites, dashboards, team seats, retention depth) and ships the same complete feature set on every paid plan, including the free one.
Simple Analytics' tiers
Simple Analytics has four published plans. Inside each paid plan, the price scales with monthly datapoint volume. Their datapoint count is pageviews plus events combined, the same way WireBoard counts any tracked hit toward the page-view quota. Different label, same underlying count.
| Simple Analytics plan | Entry price | Datapoints/mo | Sites | Team seats | What it adds |
|---|---|---|---|---|---|
| Free | $0 | 20,000 | 5 | 1 | Permanent, 30-day history |
| Simple | from $15/mo | 20,000 | 10 | 1 | Goals, events, trendlines, 3-year retention |
| Team | from $40/mo | 100,000 | 20 | 2 (then +€20/seat) | Custom views, role-based access, raw-data export, ad-blocker bypass, IP range blocking, 5-year retention |
| Enterprise | Custom | Custom | Custom | Custom | Separated data storage, manual invoicing, uptime SLA, priority support |
Yearly billing on either paid plan is twelve times the monthly rate, less two months (a 17% effective discount). A 14-day trial of every feature is included on signup; after that you pick a paid plan or stay on Free.
WireBoard's tiers
WireBoard publishes nine plans, starting at $0 forever and topping out on Enterprise. Annual billing knocks off roughly 17% (the equivalent of two free months). Every paid tier in the table below carries the entire product: every widget, every dashboard, every integration.
| WireBoard plan | Monthly | Pageviews/mo | Sites | Dashboards | Team seats | History |
|---|---|---|---|---|---|---|
| Free Plan | $0 | 50,000 | 2 | 3 | 1 | 30 days |
| Micro | $9 | 100,000 | 50 | 100 | 3 | 3 years |
| Small | $19 | 250,000 | 50 | 100 | 5 | 3 years |
| Medium | $24 | 500,000 | 50 | 100 | 10 | 3 years |
| Large | $49 | 1,000,000 | 50 | 100 | 15 | 3 years |
| Extra Large | $99 | 3,000,000 | 50 | 100 | 20 | 3 years |
| Pro | $199 | 6,000,000 | 50 | 100 | 30 | 3 years |
| Pro Plus | $399 | 12,000,000 | 100 | 200 | 50 | 3 years |
| Enterprise | Custom | Custom | Unlimited | Unlimited | Unlimited | Custom |
Same volume, side by side
The price gap follows whichever Simple Analytics plan you compare against. The Simple plan is their cheapest tier; the Team plan is the apples-to-apples comparison for buyers who want custom views, role-based access, and raw-data export.
| Pageviews/month | WireBoard | Simple Analytics Simple plan | Simple Analytics Team plan |
|---|---|---|---|
| 20,000 | Free (50k included) | Free or $15/mo | n/a (Team starts at 100k) |
| 100,000 | $9/mo (Micro) | $20/mo | $40/mo |
| 1,000,000 | $49/mo (Large, every feature) | $60/mo | $120/mo |
| 6,000,000 | $199/mo (Pro) | $160/mo | $300/mo |
Two notes on reading this table fairly. Below 1M pageviews, WireBoard is the lower raw cost at the same volume on either Simple Analytics tier; the difference at 1M with Custom views and role-based access is $49/mo vs $120/mo, or $852 saved per year. Above 5M pageviews, Simple Analytics' Simple plan ($160/mo at 5M-10M) drops below WireBoard's Pro plan ($199/mo at 6M); if you only ever need the cheapest single-user tier and are running very high volumes, the raw cost favors them at that scale.
Three differences that move the buying decision
- WireBoard is the lower raw cost across the volumes most teams operate at. At 100k, 250k, 500k, and 1M monthly pageviews, WireBoard is consistently below either Simple Analytics paid tier. At 1M pageviews with the features most buyers actually want (multiple users, custom views, role-based access), the WireBoard Large plan is $49/mo vs Simple Analytics Team's $120/mo.
- Free plan, every feature included, no expiry. WireBoard's Free Plan ships with 50,000 pageviews, 2 sites, 3 dashboards, every feature, no credit card, no clock running on a trial. Simple Analytics also has a permanent free tier (20,000 datapoints, 5 sites) but reserves Goals, events, and trendlines for the Simple plan and above.
- No feature gating. Funnels, revenue tracking, custom events with properties, multi-site live aggregation, the SEO suite, scheduled email reports, embed tokens, Streamer Mode: every one of them ships on every WireBoard plan. With Simple Analytics, the most useful capabilities (Goals, multiple users, custom views, role-based access, raw-data export) sit on the Simple plan or above.
Don't decide on theory. Install both.
A comparison post will settle this question more slowly than two script tags will.
Simple Analytics opens every feature for 14 days with no card up front. WireBoard's Free Plan stays open forever, no card, every feature on. Pick a real site you can wire up, and the answer arrives the same afternoon you start.
- Drop both scripts on the same site, then open the dashboards next to each other. Hit the page from your phone or a private window. Notice which dashboard reflects the visit immediately and which one waits for its next refresh.
- Pick one question your work actually depends on, and answer it in each tool. Maybe it's "which campaign converted on Tuesday by country," maybe it's "did the morning's deploy lose me visitors," maybe it's "which of my sites is having the worst day right now." Whichever dashboard answers first wins on your shape of work.
- Hold each pricing page next to your real usage. Plug in your monthly pageview count, your number of sites, and your number of team seats. The tables in the previous section already line up the numbers; your real workload picks between them.
The five questions above stop being abstract the moment both products are running on the same domain.
Pros and cons at a glance
| WireBoard | Simple Analytics | |
|---|---|---|
| + | ✅ True real-time, streaming live ✅ 60+ widgets, fully customizable ✅ Multi-site live in one view ✅ SERP volatility + Google update tracking ✅ Public API (REST + Live SSE) with JS/Python SDKs ✅ MCP server for Claude Desktop, Cursor, etc. ✅ Every feature on every plan, even free |
✅ AI chat built into the dashboard ✅ Native iOS app ✅ Looker Studio + Power BI connectors |
| − | ❌ No native iOS app ❌ No in-dashboard AI chat (MCP only) |
❌ Not marketed as real-time ❌ One fixed dashboard per site ❌ No multi-site live aggregation ❌ No SERP / Google-update tracking ❌ Goals gated to Simple plan and up |
The bottom line
Simple Analytics is the right pick in three narrow situations: you want the smallest possible dashboard footprint, you live inside Looker Studio or Power BI and want a connector that already exists, or you read your traffic on an iOS home-screen widget every morning.
For everyone else, WireBoard is the better fit. Streaming live data the second a hit arrives. A drag-and-drop canvas with multiple dashboards on every site and three themes. Aggregated live traffic from a portfolio of sites in one widget. SERP volatility and Google update signals embedded right beside the traffic charts. The same complete feature set on every plan, including the permanent free one. No locked funnels, no locked revenue tracking, no locked custom events.
Start tracking for free with WireBoard. 50,000 pageviews per month, 2 websites, 3 dashboards, every feature included. No credit card. No trial period. No catch.
Sources
WireBoard
- WireBoard homepage
- WireBoard pricing
- WireBoard features
- SERP volatility live tool
- Google Core and Spam Updates timeline
- WireBoard product timeline and changelog
- WireBoard privacy policy
- WireBoard documentation
- WireBoard public API overview
Simple Analytics (where the claims about their product are grounded)
- Simple Analytics pricing
- Simple Analytics documentation
- Simple Analytics public API documentation
- Simple Analytics Goals documentation
EU data protection and infrastructure