

Which should you pick: WireBoard or Google Analytics 4?
GA4 and WireBoard are both web analytics tools, and they overlap on the basics: pageviews, sources, devices, conversions, custom events. After that they diverge. GA4 sits inside Google's broader marketing stack, with built-in linking to Google Ads, Search Console, and BigQuery, deployment via Tag Manager, and a first-party Looker Studio connector. WireBoard is an independent analytics product, EU-hosted, with no ad-platform integration.
Pick Google Analytics 4 if you run paid acquisition through Google Ads and need native audience push and bid-side conversion import, if you measure web alongside iOS and Android in one property, if your team already lives inside the Google stack (BigQuery, Tag Manager, Looker Studio), or if your traffic is small enough that a free tool with sampling and retention caps is the right shape for now.
Pick WireBoard if you watch traffic live during launches, ad runs, and Google update days, if you want every count to be the real count, if you operate several sites and want them on a single dashboard, if you keep arranging your reports around the way you actually work, or if SERP volatility and Google update tracking belong on the same screen as your traffic.
Down the page: the side-by-side scoreboard, the four real differences between the two products, where GA4 leads today, where WireBoard does, the pricing math, and how to compare them on your own site.
At a glance
| WireBoard | Google Analytics 4 | |
|---|---|---|
| Real-time | Live concurrent visitors and pages being viewed, plus 20+ live widgets, all updating instantly | Realtime card, last 30 minutes |
| Sampling at high volume | None, every chart is the real count | Above 10M events per query in explorations on the standard tier |
| (other) row from cardinality limits | None | Yes, above the dimension's cardinality limit |
| Data retention | 3 years on every paid plan | 14 months maximum on the standard tier |
| Dashboards | 60+ widgets, drag-and-drop, multiple per site, populated default | Standard reports plus self-built explorations |
| Multi-site live aggregation | One widget across any selection of sites, streaming | Per property; cross-property rollups need manual setup |
| SEO suite (SERP volatility, Google updates) | Included on every plan | Not offered |
| Annotations layer on time-axis charts | Four built-in layers + per-user notes | Not offered |
| Funnels (real-time) | Every plan, flexible order | Funnel exploration, sampled above the threshold |
| Custom events with properties | Every plan, including free | Yes, with configuration caps |
| Free plan | Permanent, every feature, 50k PV/mo | Standard tier, free, with sampling and retention caps |
| Paid plan ladder | $9, $19, $24, $49, $99, $199, $399, custom | Free, then GA360 from ~$50,000/year |
| Data path | EU in-house pipeline, processed by SwissOps Ltd. | Google Cloud, integrated with the wider Google ad ecosystem |
| EU regulator status | Hosted entirely on EU infrastructure, no third-party transfer | Multiple EU DPAs ruled Universal Analytics non-compliant; Data Privacy Framework added since |
| Cookieless mode | Optional toggle, off by default for accuracy | Available via Google Consent Mode v2 |
| Setup time | About 2 minutes (one script tag) | Tag Manager + custom dimensions + conversions usually needed |
| Public API | REST + live event-stream (SSE) + official MCP server, single bearer token | Data API + Realtime API (30-min aggregations), requires GCP project + service account |
Yes, GA4 is hard. That alone is not the answer.
Let's get the obvious thing out of the way first: GA4 is hard. The interface is dense, the events model is unfamiliar to anyone coming from Universal Analytics, and the path from "tag installed" to "useful dashboard" runs through Tag Manager, custom dimensions, and a couple of late-night YouTube tutorials. People have been complaining about this since the UA shutdown, and the complaints are not wrong.
WireBoard is simpler. New accounts open onto a populated dashboard the moment you finish signing up; the depth is in the widgets you can drop in afterward, not in the configuration you have to do first.
If "easier to learn" was the only criterion, every minimalist analytics tool on the market would beat GA4. Most of them do not, because there are other things buyers want from analytics that GA4 still does well and WireBoard does not. The interesting comparison sits in the differences below, three of which are about what each tool can do, not about how steep the learning curve is.
Four real differences
Past the learning curve, four design choices set the two products apart. Each one is a place where I made the opposite call when I built WireBoard.
1. Real-time: last thirty minutes, or streaming live?
GA4's Realtime report covers a fixed thirty-minute lookback window. You cannot widen or narrow it. Inside that window: active users in the last 30 minutes with a per-minute breakdown, top events, top pages, source/medium, a geographic map showing user locations as bubbles, and a user snapshot for inspecting one visitor at a time. The cards refresh as new hits arrive, with the few-minute processing delay Google calls out in the documentation. Every metric is an aggregation over the trailing thirty minutes.
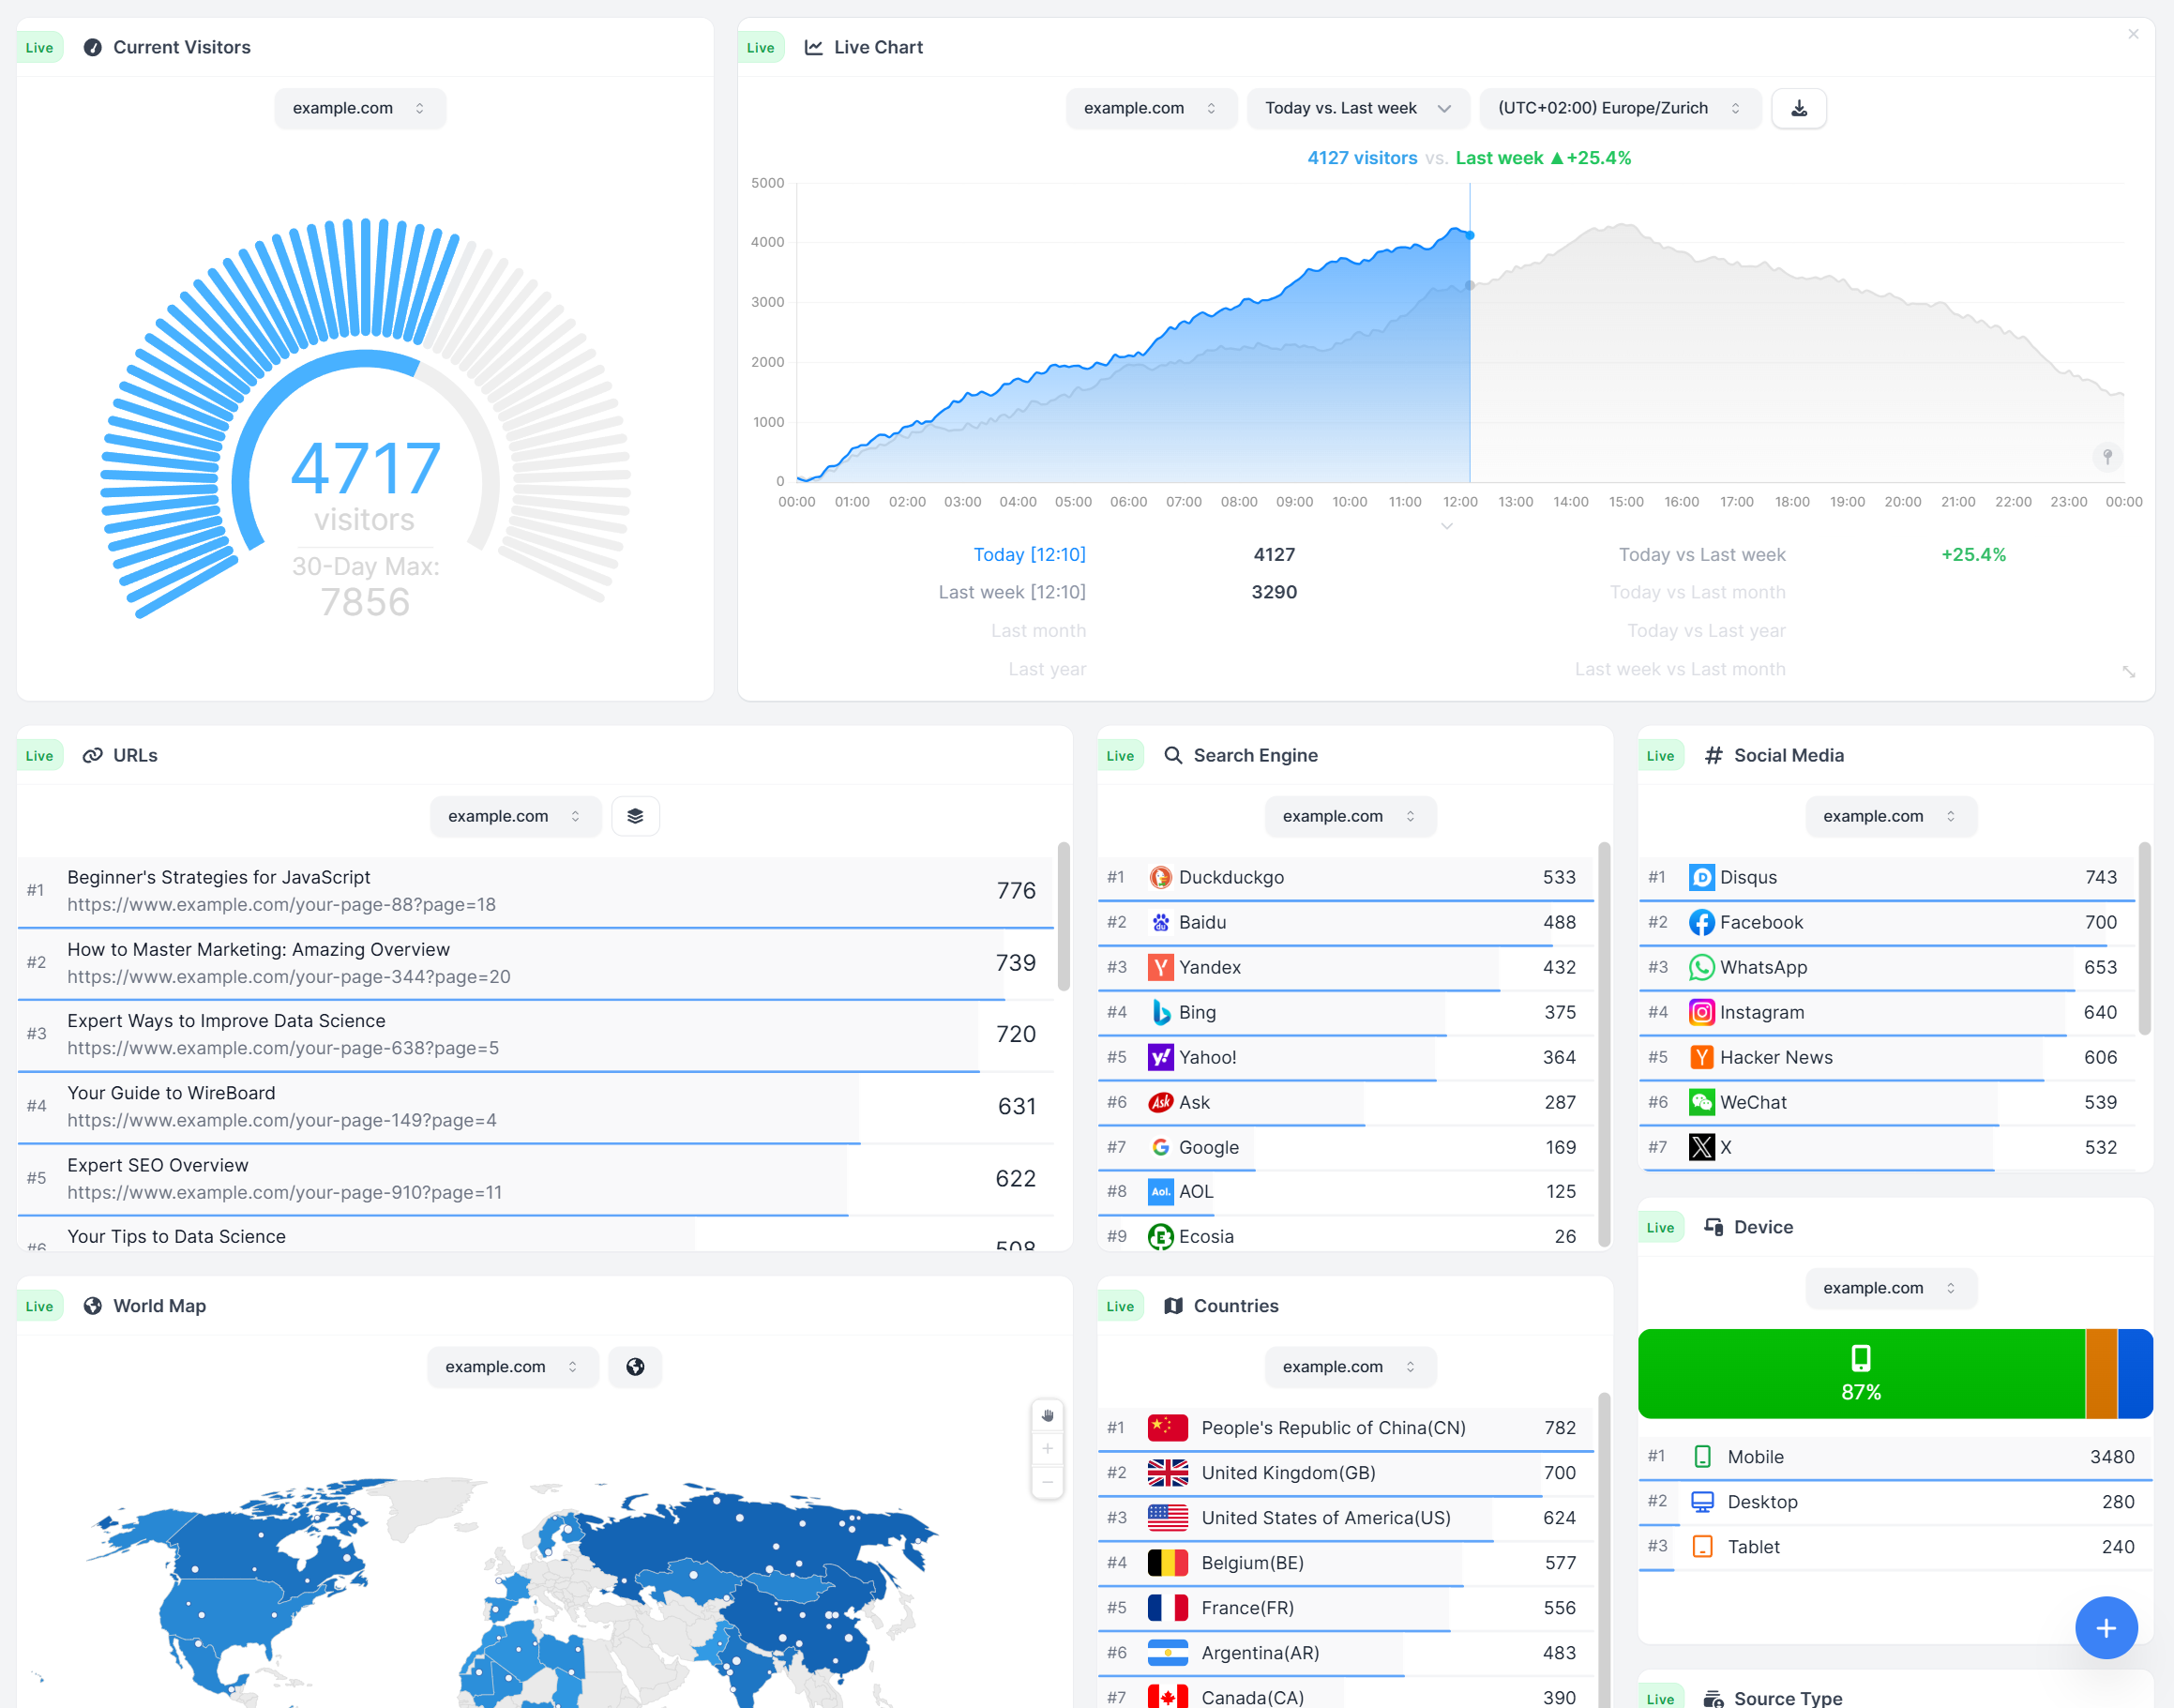
WireBoard separates live and reports. The live surface monitors what is happening on the site as it happens. In WireBoard's own framing on its features page: "monitor visitors, pages, traffic sources, and devices as they happen." The two leads are a live count of concurrent visitors on the site right now and a live view of which pages they are reading. Around those, the public features page names the world map, traffic sources, device breakdown, and real-time funnels, with the rest of WireBoard's 20+ live widgets behind them, all updating instantly. The live visitor counter is a real-time count of who is on the site at this exact moment, not a trailing-window aggregation. Reports are a separate surface: date-range stats, period-vs-period, the URL Explorer, the activity heatmap, and historical concurrent-visitor averages (today's running average, yesterday, the past month) all work on stored data.
If your routine is checking analytics on a Monday morning, the gap is invisible. If you are watching SERP volatility on a Google update day, running a flash sale, or reading the dashboard during a launch, the gap is the whole reason to switch. We built WireBoard's pipeline in-house because streaming is not the kind of feature you bolt onto third-party ingestion after launch.
2. Sampled estimates above the threshold, or every number is the real number?
Most "GA4 is fine for small sites" reviews skip this part. On a standard GA4 property, explorations sample any query that exceeds 10 million events in the selected date range; on Analytics 360, that threshold rises to roughly a billion. Below it, the numbers are the real numbers. Above it, they are estimates from a sample. The same family of behaviors covers cardinality: when a dimension exceeds its row limit, GA4 condenses the long tail into an "(other)" row, and high-traffic page paths, search terms, and event labels are the usual things to disappear into it.
WireBoard does not sample. There is no (other) row. Every page, every referrer, every event, every UTM tuple is counted as itself, on every plan, including the free one. The trade-off runs the other way: plans are quota-bounded by page views per month, and exceeding the quota pauses collection. Inside the quota you paid for, the numbers are not estimates. They are what happened.
Two different shapes of "free." GA4 is free in dollars and sampled above the threshold. WireBoard is free in dollars up to 50,000 page views per month and unsampled inside that window.
3. A data path that ends at the ad ecosystem, or one that ends at your dashboard?
GA4 runs on Google's infrastructure and integrates natively with Google's other advertising and data products: Google Ads, Display & Video 360, Search Ads 360, YouTube measurement, BigQuery, Looker Studio. That integration is why most teams use it. Data flows to Google Cloud, optionally streams to BigQuery, and is available for audience-building and bid-side conversion attribution inside Google's ad platforms.
EU regulators have been litigating this design since 2020. The Austrian DSB, France's CNIL, Italy's Garante, and Norway's Datatilsynet all issued findings that Universal Analytics did not satisfy GDPR's transfer rules under Schrems II. The 2023 EU-US Data Privacy Framework adequacy decision restored a legal basis for many of those transfers, and Google is certified under the framework. NOYB is challenging the framework again, so most legal teams treat the regime as something to keep a hosting contingency ready for.
WireBoard takes the other path on purpose. The full pipeline (collection, processing, storage, dashboards) is built and operated by SwissOps Ltd. on EU infrastructure. No third-party ingestion, no US transfer, no ad-platform integration. The trade-off is real: there is no native push from WireBoard into Google Ads' bidding stack the way GA4 has. If that integration is what you bought GA4 for, this difference goes the other way.
4. Configure your way into the dashboard, or land on a populated one?
Setting up GA4 well is a project. Tag Manager goes in. Conversions are configured. Custom dimensions are registered against the cardinality budget. Internal-traffic filters are defined. The Standard reports are useful out of the box but shallow; depth lives in Explorations, which you build yourself. The teams I know who are happy with GA4 had an analytics agency or an in-house specialist do the setup once and maintain it from there.
WireBoard is one script tag and a sign-in. New accounts open onto a default board with traffic, top pages, referrers, device splits, the world map, and the live event feed already in place. From there: drag in the widgets you want, spin up a second board for the weekly review, a third for client demos, switch themes. Multiple boards per site. Sixty-plus widgets, three themes, drag-and-drop.
The deeper version of this question: who pays the configuration tax? GA4 collects it up front, in setup hours and the agency invoice. WireBoard ships a working dashboard on day one, and you customize from there only if you want to.
What GA4 does better than WireBoard today
GA4 is the dominant tool for reasons that are not all about inertia. Real capability gaps where WireBoard does not currently match it:
Native Google Ads integration. GA4 audiences push to Google Ads for remarketing; GA4 conversions import into Google Ads bidding; GA4 sessions feed Smart Bidding. WireBoard captures UTM parameters and tracks conversions, but it does not push into the bidding stack. If you run paid acquisition through Google Ads, GA4 is the structural fit.
Web + iOS + Android in one property. GA4 unifies web and app data using the Firebase SDK on mobile. WireBoard is web-only. If you operate a SaaS with both a web app and native apps and want one tool for both, GA4 has the edge.
BigQuery raw event export. Even on the free standard tier, GA4 exports raw event-level data to BigQuery (with a daily 1-million-event cap on standard properties; 360 removes the cap). For teams that already run analyses in SQL on a warehouse, that export is the foundation of the workflow. WireBoard exports manually or on a schedule to CSV / JSON / XLS / XLSX / ODS, plus S3, FTP, or SFTP destinations, and now ships a read-only public REST and live event-stream API you can pull into your own product or warehouse pipeline. What WireBoard does not yet ship is a warehouse-shape raw event export in the BigQuery mold; for teams whose workflow starts from a daily event-level dump in their warehouse, that one is still a real gap.
Predictive metrics out of the box. GA4 ships predictive audiences and predictive metrics (purchase probability, churn probability) for properties with enough event history. WireBoard does not currently ship predictive scoring.
The ecosystem. Tag Manager, certified partners, agency familiarity, the Looker Studio connector, the Search Console link, the YouTube channel link, the depth of community tutorials and Stack Overflow answers: all downstream of GA4 being the default tool. If you already have a GA4 specialist on retainer, that is not a small thing.
Free until you hit a wall. Below the sampling threshold and the retention cap, the standard tier costs nothing. WireBoard's permanent free plan is generous (50k PV/mo, every feature included), but if your needs sit comfortably under GA4's walls, free in dollars is hard to argue against.
Six advantages, sourced to the docs and pricing pages, not the marketing copy.
What WireBoard offers that GA4 doesn't
Now the inverse, sourced to what is shipping in each product:
Streaming live widgets, not a half-hour card. The two leads: a live counter of concurrent visitors right now and a live view of which pages they are reading. Behind those: the world map, traffic sources, device breakdown, real-time funnels, and the rest of the 20+ live widgets, all updating instantly. Reports are a separate surface and work on stored data.
No sampling, no (other) row, no cardinality cap. Every page, every referrer, every search term, every UTM tuple shows up as itself, on every plan. The chart you are reading is the count, not an estimate.
Live aggregation across your portfolio in one widget. Point the multi-site widget at any selection of your sites and watch their live traffic stream into a single view. GA4 supports cross-property aggregation through manual rollups or BigQuery joins; WireBoard ships it as a default panel. For anyone running more than one site, this is where the day-to-day workflow gap shows up.
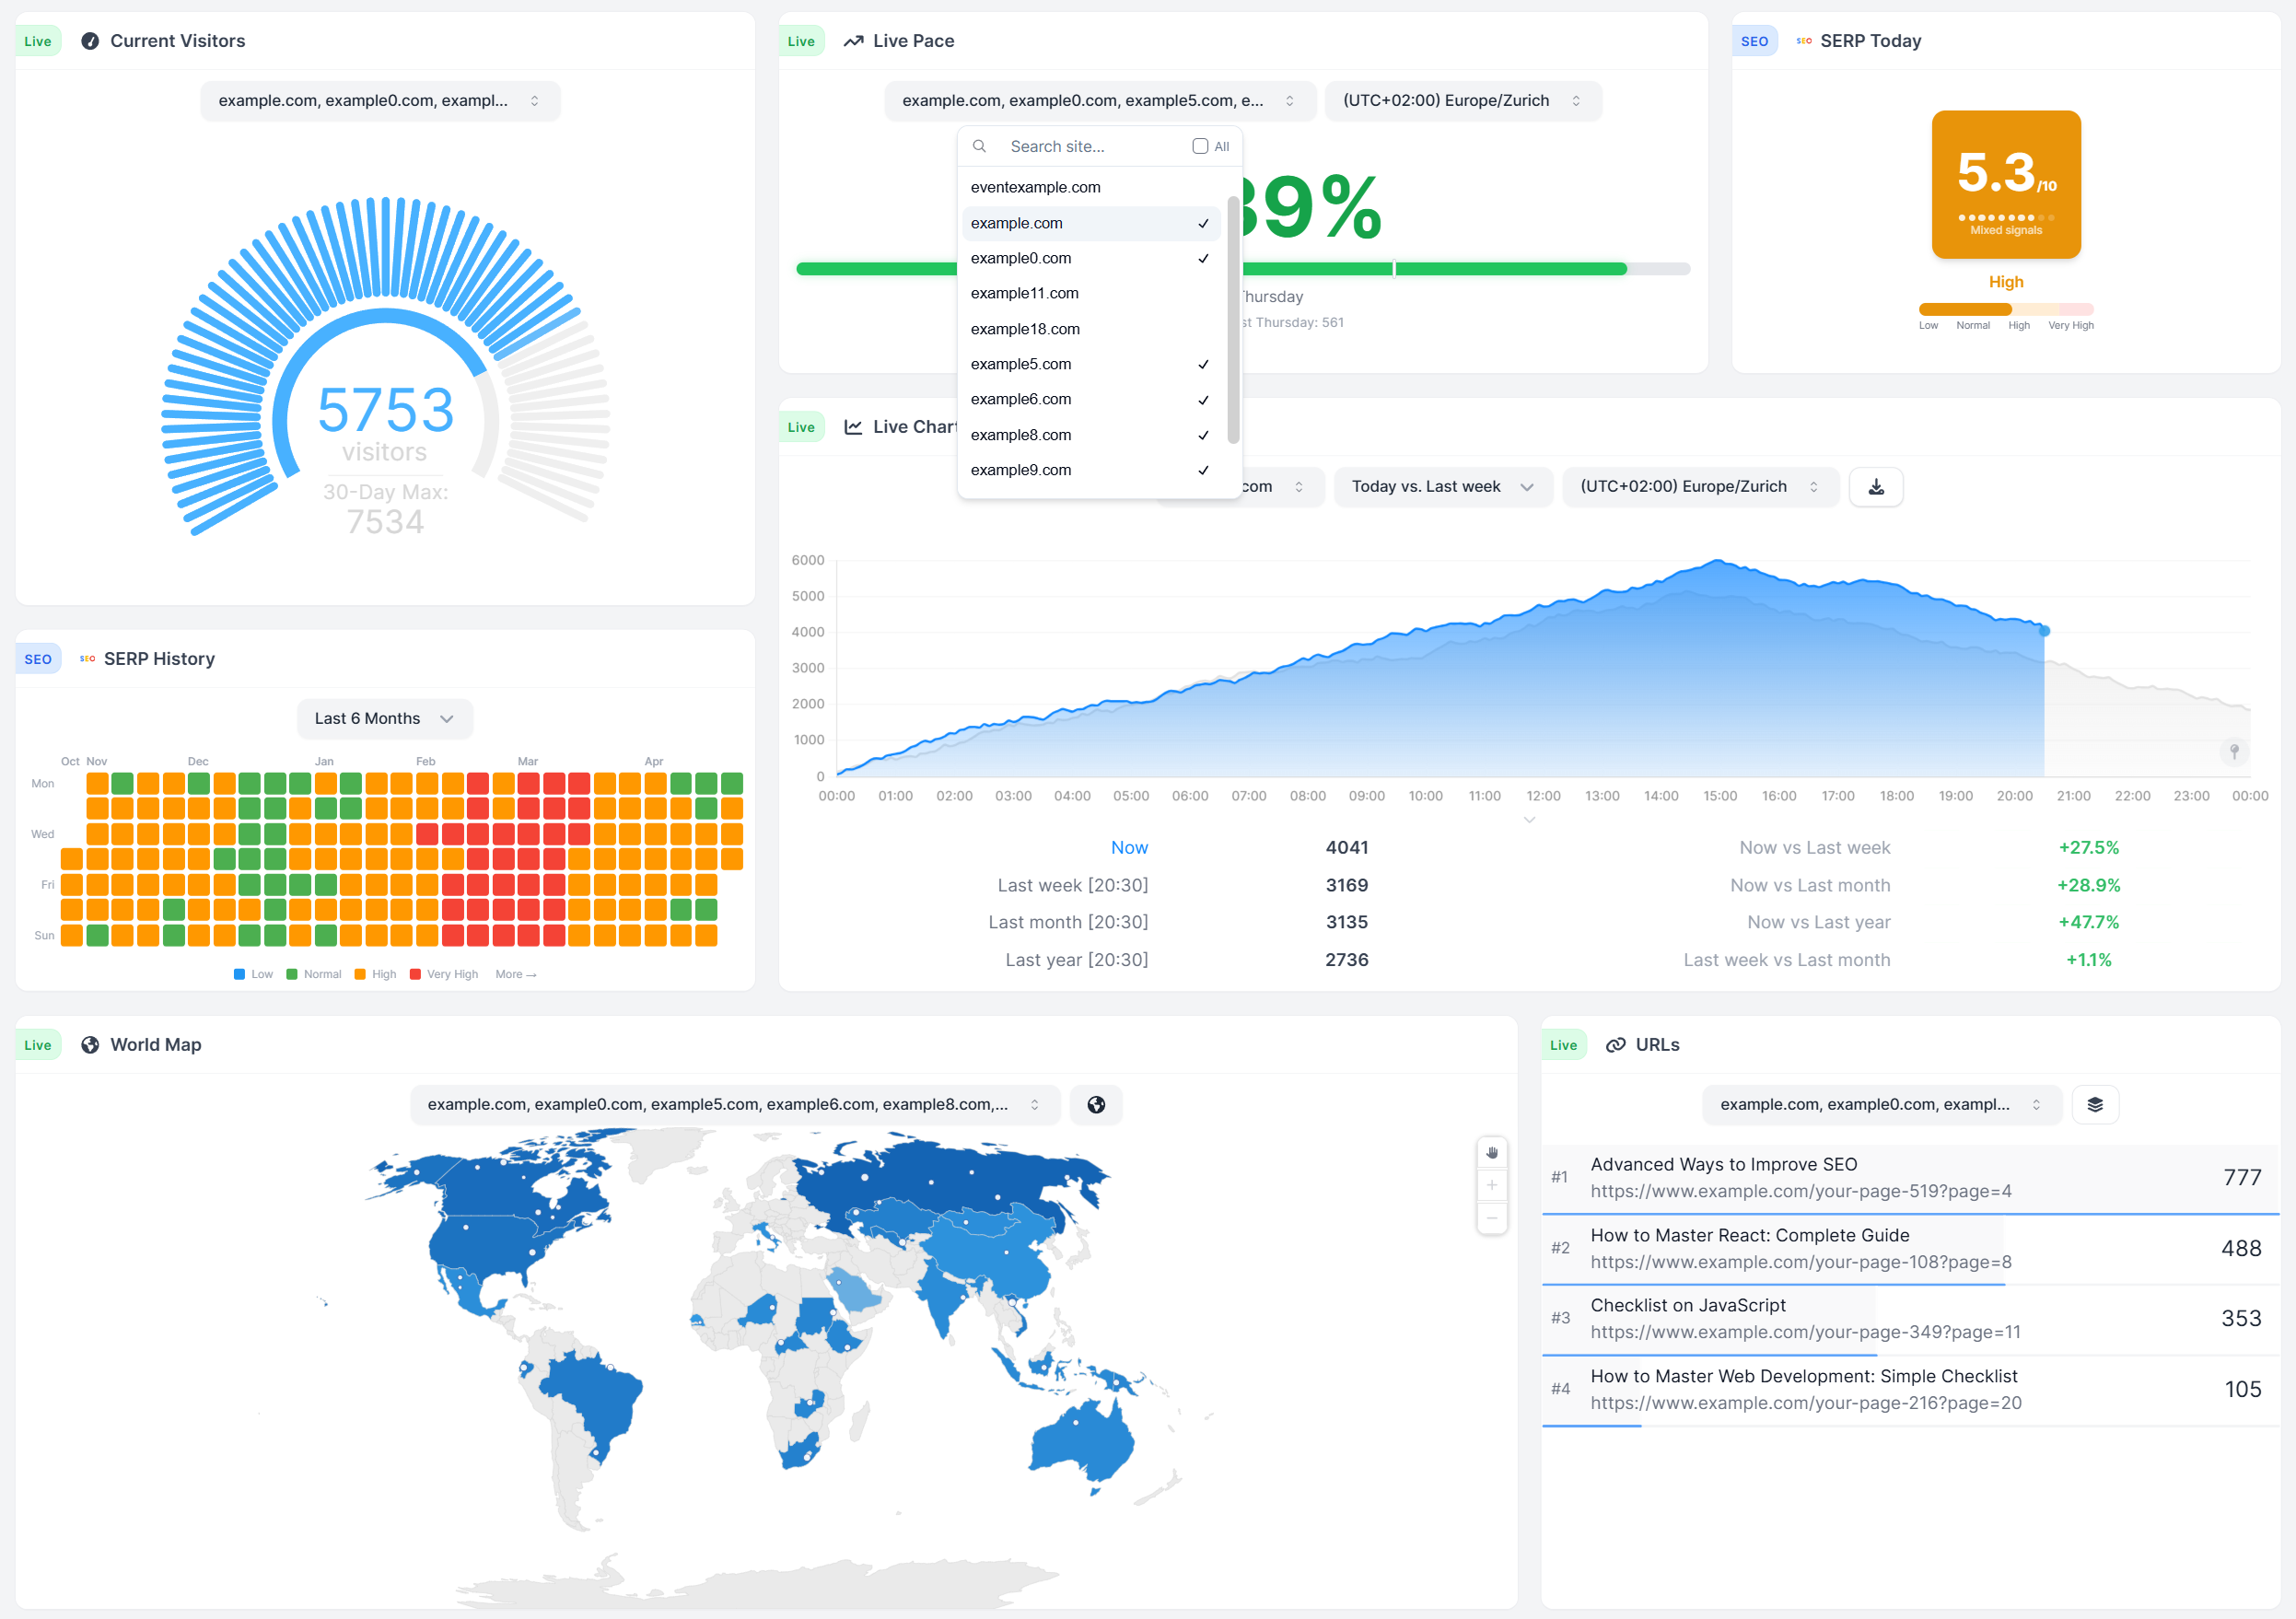
An integrated SEO suite. SERP volatility, live. A Google Core and Spam Updates timeline. A public-holiday overlay broken out by country. GA4 ships nothing in that category. On a Google update day, this is the difference between knowing in thirty seconds and chasing the answer through Twitter.
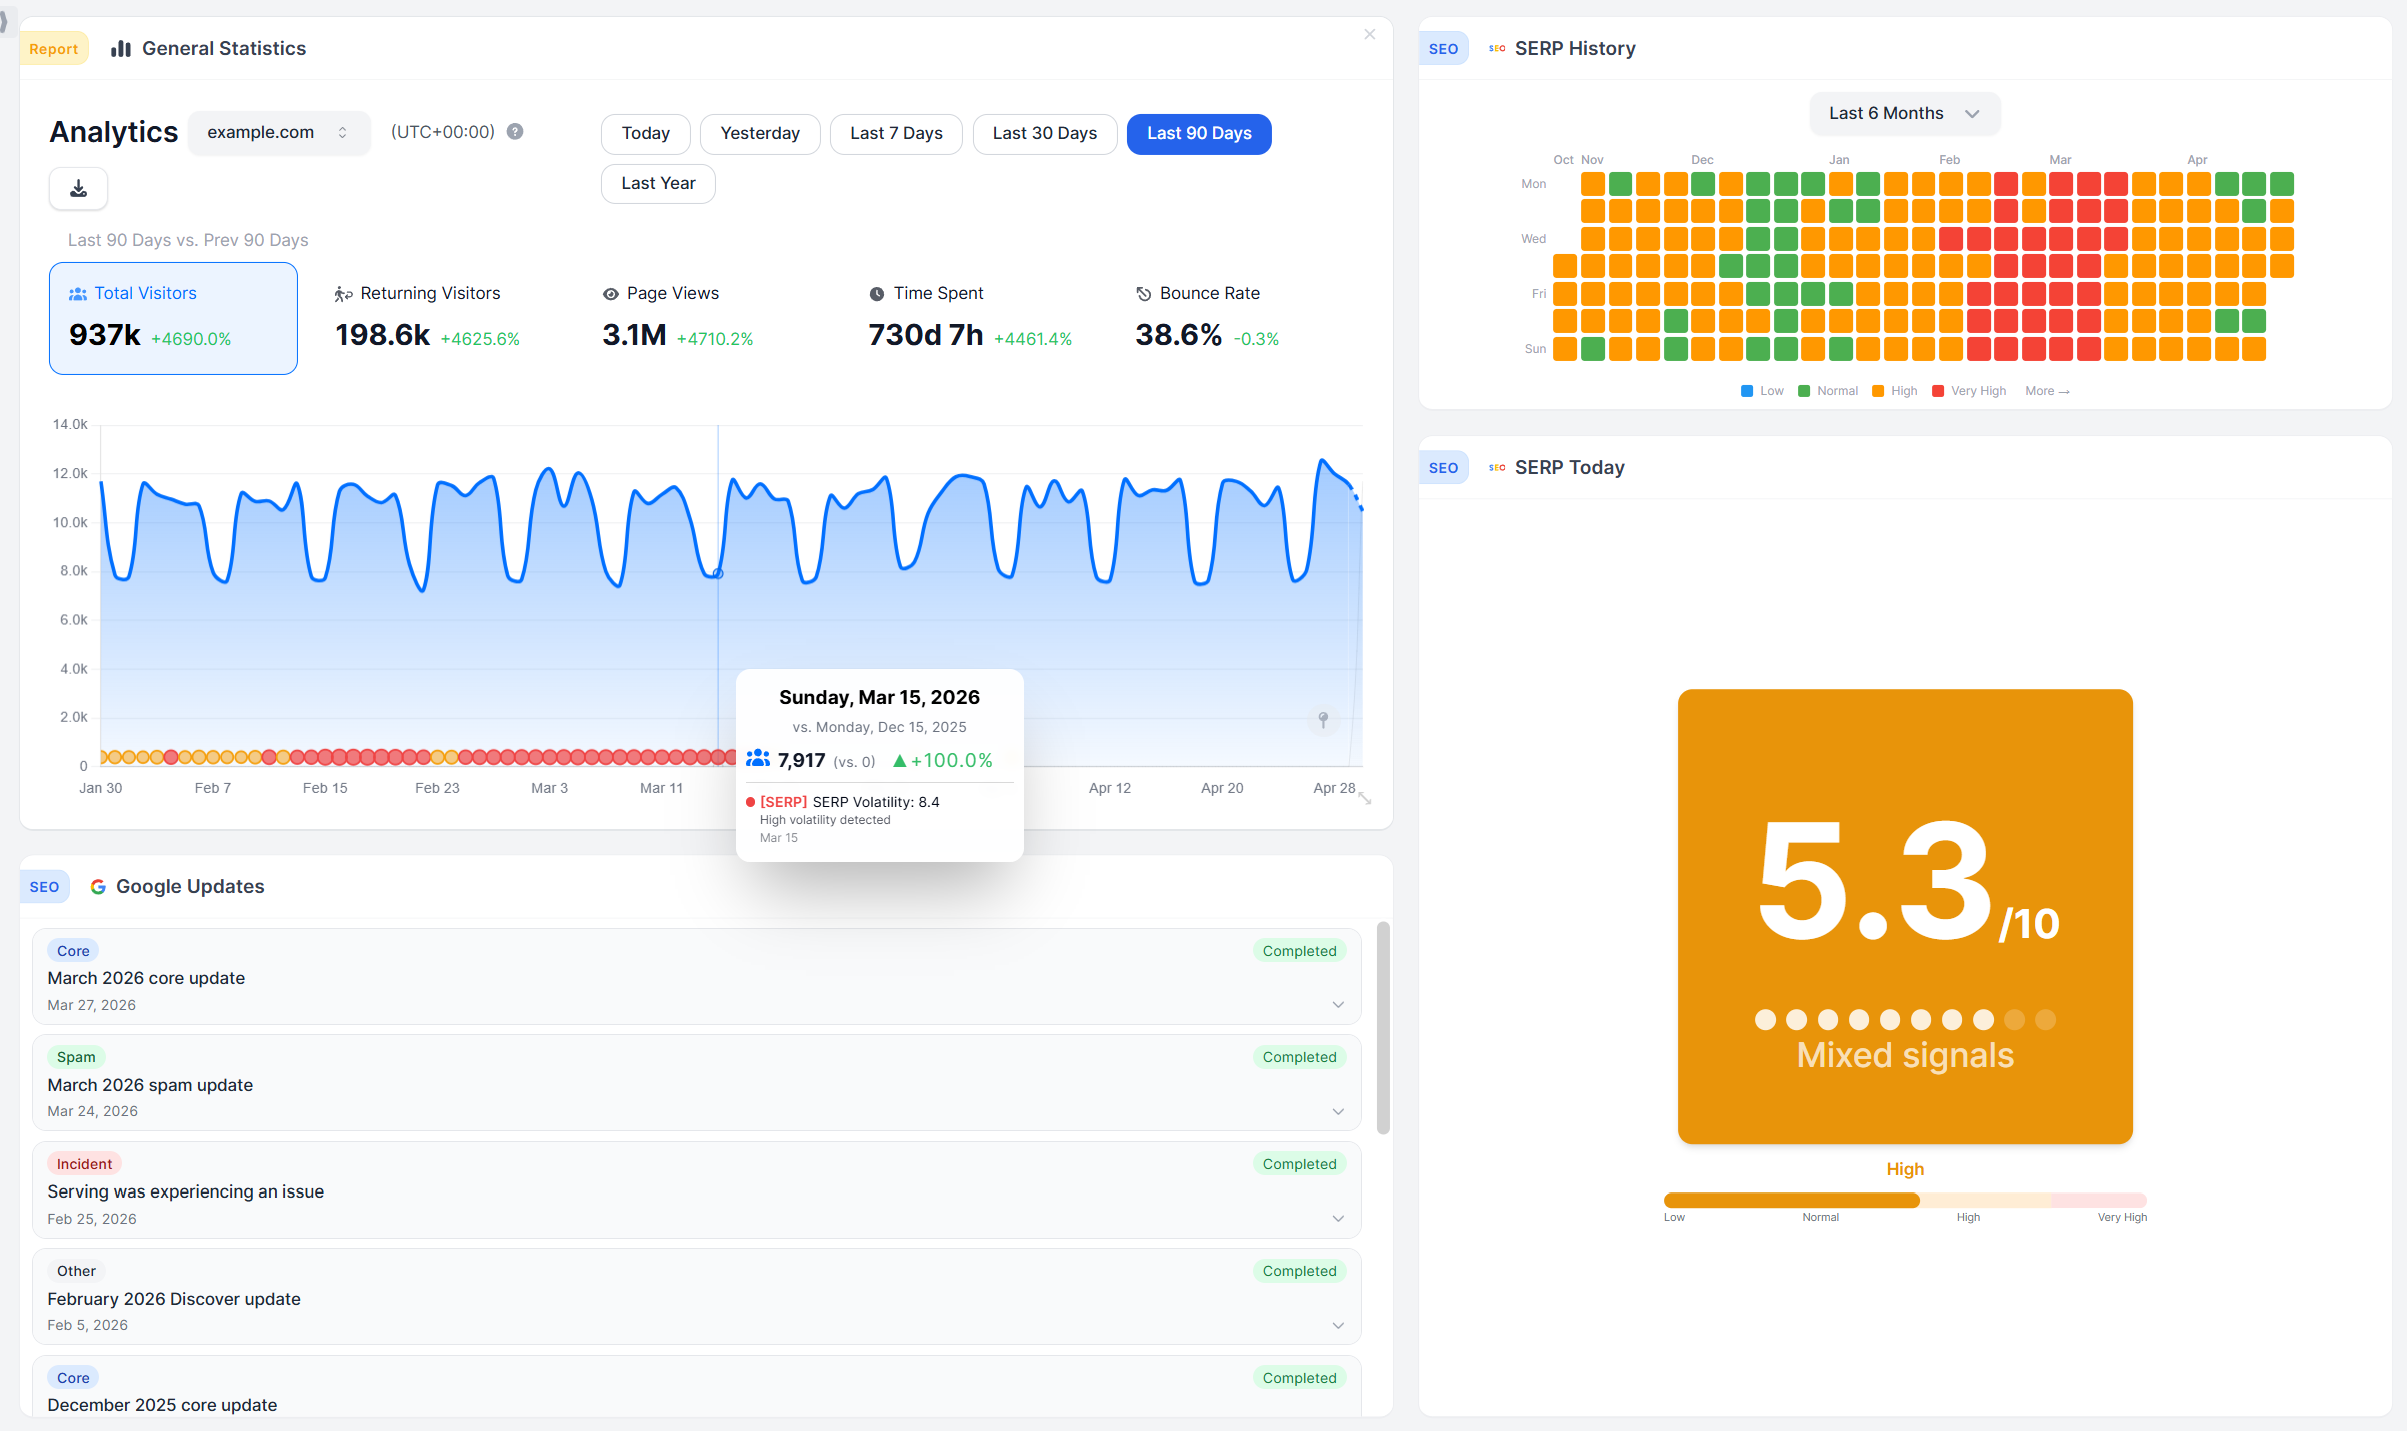
Annotations on every time-axis chart. Four overlay layers ship in the box (deploys and your own events, Google rollouts, SERP-volatility days, and country-aware public holidays), and team members can add their own notes. GA4 retired its annotation feature and has not brought it back.
Drag-and-drop dashboards: sixty-plus widgets, three themes, multiple boards per site. GA4's surface is Standard reports plus user-built Explorations. WireBoard's dashboards are the product, not a reporting layer over it.
Three-year retention on every paid tier. GA4 standard tops out at fourteen months. WireBoard ships three years from the nine-dollar Micro plan upward, no toggles required.
Streamer Mode and one-keystroke screenshots. Blur domains, URLs, and titles for screen shares and screenshots; Shift+C saves a PNG of whatever you are looking at.
A first-party WordPress plugin. One-click install from wp-admin, dashboards rendered inside the admin panel, magic-link sign-in for editors. Most GA4 installs on WordPress route through Site Kit or third-party plugins; WireBoard maintains its own.
Goals with revenue per event-property value. Conversion count, conversion rate, and revenue per goal, broken out by tier, country, device, browser, or source, with a trend chart.
Per-graph or per-site timezone. Every chart can carry its own. GA4 uses one timezone per property.
What you get when you pick WireBoard as a Google Analytics alternative
By the time someone searches "Google Analytics alternative," they have usually spent an evening lost in GA4's Explore tab or watched their visitor data leave Europe and decided that's not how they want to run the next year. WireBoard opens onto a populated dashboard the minute you sign up. Live widgets stream from the start: a visitor counter, a world map, a referrer panel, and the event feed, all advancing as hits arrive. The entire pipeline runs on EU infrastructure end to end, no third-party ingestion.
Running paid acquisition across several sites? One live widget rolls them all into one streaming view. Hit by a Google update? SERP volatility and the core-and-spam-update timeline sit on the same dashboard as your traffic. Tracking goal conversions and revenue? Goals break out conversion rate and revenue by plan tier, country, device, browser, or source.
GA4 still wins if you live in Google Ads, BigQuery, Tag Manager, Looker Studio, and Search Console natively. For everyone else, every WireBoard feature is on every plan, the permanent Free Plan covers 50,000 pageviews on two sites and three boards, and WireBoard is the Google Analytics alternative for teams whose job is the website itself.
Should you trust this comparison?
Reasonable thing to ask. The disclosure:
I run WireBoard. I had GA4 on my own sites for years before I started this company, and I have spent more hours inside the Analytics Help center than I would have chosen. This post is what I keep emailing prospects who ask me, in plain language, how the two tools actually differ in practice. Where GA4 is the better fit, I'll write it. Where WireBoard is, I'll write that, and link the sources.
Two more weights:
Where the claims come from. Every claim about GA4 points at official Google documentation, the Analytics Help center, or a primary regulatory finding. Every claim about WireBoard reflects what is shipping today; the few roadmap items (BigQuery-shape event export, Slack-native reporting, configurable traffic-spike alerts) are flagged with that exact language.
Who picks WireBoard. Barry Schwartz at Search Engine Roundtable wants SERP volatility next to live traffic on Google update days. Robert Farrington at The College Investor reads his publishing numbers on a dashboard he can rearrange around the question of the week. Jon James at TeamGreet runs a SaaS where conversions per plan tier sit on the dashboard. They picked WireBoard for reasons that line up with what is in this post.
How the pricing actually plays out
Prices below were recorded from each company's published pricing page in May 2026. Both Google and WireBoard adjust pricing periodically. Before making a buying decision, verify current rates on the Google Analytics 360 page and the WireBoard pricing page.
GA4's pricing is two-tier and unusually shaped: free at the standard tier, then a long jump to Google Analytics 360 from roughly $50,000 a year (negotiated, not published). WireBoard's pricing is a smooth ladder of nine plans and an Enterprise option, with every feature on every paid tier. The interesting comparison is not "free vs paid"; it is what each tier is really getting you.
GA4's tiers
| GA4 plan | Price | Sampling threshold (explorations) | BigQuery export | Retention | Notes |
|---|---|---|---|---|---|
| Standard | Free | 10M events per query | 1M events/day cap on standard properties | 14 months max | Configuration limits on custom dimensions, metrics, conversions |
| Analytics 360 | from ~$50,000/yr | 1B events per query | No daily cap | 50 months max | Custom contract, sales-led, sub-property surcharges may apply |
GA4's standard tier is free for any volume and stays useful well up the volume curve. The cost shows up as sampling, the (other) row, the daily BigQuery cap, the configuration ceilings, and the engineering hours spent working around them. That cost is real; it just does not appear on an invoice.
WireBoard's tiers
The WireBoard pricing page lists nine plans, starting from $0 with no expiry. Yearly billing knocks roughly 17% off the monthly rate (two months free), and every paid tier carries the full feature set.
| WireBoard plan | Monthly | Pageviews/mo | Sites | Dashboards | Team seats | History |
|---|---|---|---|---|---|---|
| Free Plan | $0 | 50,000 | 2 | 3 | 1 | 30 days |
| Micro | $9 | 100,000 | 50 | 100 | 3 | 3 years |
| Small | $19 | 250,000 | 50 | 100 | 5 | 3 years |
| Medium | $24 | 500,000 | 50 | 100 | 10 | 3 years |
| Large | $49 | 1,000,000 | 50 | 100 | 15 | 3 years |
| Extra Large | $99 | 3,000,000 | 50 | 100 | 20 | 3 years |
| Pro | $199 | 6,000,000 | 50 | 100 | 30 | 3 years |
| Pro Plus | $399 | 12,000,000 | 100 | 200 | 50 | 3 years |
| Enterprise | Custom | Custom | Unlimited | Unlimited | Unlimited | Custom |
Same volume, different shape
| Volume | WireBoard | GA4 standard | Where the math lands |
|---|---|---|---|
| 50,000 / month | Free, every feature, 2 sites | Free, sampled above 10M events per exploration, 14-mo retention | Both free; WireBoard ships dashboards, multi-site live, SERP + Google-update tracking |
| 1M / month | $49/mo (Large), 50 sites, 3-yr history, 15 seats | Free, sampling on explorations above 10M events per query | GA4 wins on raw cost; WireBoard wins on capability per dollar and unsampled depth |
| 6M / month | $199/mo (Pro), 30 seats, 3-yr history | Free, sampling on most multi-month explorations | GA4 wins on raw cost; WireBoard wins on unsampled accuracy and dashboard breadth |
| Past the sampling wall, unsampled | $399/mo Pro Plus (~12M PV) or Enterprise (custom) | ~$50,000+/yr (GA360) | Where unsampled matters, WireBoard is the smaller invoice |
WireBoard does not win the dollar comparison at low volume. It does not try to. The flip point is where you start needing the things GA4 standard asks you to live without: unsampled charts on every query, retention longer than fourteen months, BigQuery exports that do not pause at a daily cap, configuration that does not collide with custom-dimension ceilings, a dashboard surface that ships ready to read.
Three differences that move the buying decision
-
Free is not the same as no cost. GA4 standard costs zero dollars plus a list of trade-offs (sampled explorations above 10M events per query, the (other) row above the cardinality limit, fourteen-month retention, a daily 1M-event BigQuery cap, configuration ceilings on custom dimensions and conversions). WireBoard's $9 Micro plan ships three years of history, no sampling, no (other) row, every feature, scheduled exports, public dashboards, embed tokens. Different shapes of "what does free actually buy?".
-
The jump from GA4 standard to GA360 is a cliff. Going from "free, with sampling above 10M events" to "unsampled, with sampling above 1B events" on Google's stack means GA360 at roughly $50,000 a year minimum. WireBoard's ladder ($9, $19, $24, $49, $99, $199, $399, custom) covers the same gap as a smooth scale. WireBoard's Pro Plus tier handles 12M page views per month at $4,788 a year. The unit difference (page views vs events) does not move the order of magnitude.
-
No WireBoard feature is gated behind a tier. Real-time funnels, revenue per goal, custom events with properties, SERP-volatility and Google-update tracking, the multi-site widget, embed tokens, Streamer Mode, scheduled exports to S3 / FTP / SFTP: all of it ships on the free plan and stays unlocked on every paid plan. GA4 structures gating differently: there are two states (standard and 360), and the only way past the standard limits is the 360 contract.
See for yourself. Install both.
Reading is the slow road to this answer. Run the tags in parallel.
GA4's standard tier is free; WireBoard's free plan is permanent and free. Add both tags to one real site, send some real traffic at it, and watch each dashboard.
Three checks worth running:
- Put the two dashboards side by side on one monitor. Have your phone load the homepage, or ask a teammate to click around. Watch how long each tool takes to acknowledge that visit. The streaming-vs-Realtime-card gap shows up immediately.
- Wait for a real spike. A newsletter going out, a press mention going live, a paid run kicking off, a Friday-night search spike on a high-intent page. Decide which dashboard you'd want open while it is happening.
- Ask each tool a question off your actual to-do list. Maybe "what converted from yesterday's UTM, sliced by country?" Maybe "did Friday's deploy change anything I should care about?" Maybe "is Google ranking turbulent on my pages right now?" Whichever dashboard surfaces the answer first wins on the work you actually do.
Three runs of that, and the differences above stop being theoretical.
Pros and cons at a glance
| WireBoard | Google Analytics 4 | |
|---|---|---|
| + | ✅ True real-time, streaming live ✅ 60+ widgets, fully customizable ✅ Multi-site live in one view ✅ SERP volatility + Google update tracking ✅ Public REST + live SSE API and official MCP server ✅ Every feature on every plan, even free |
✅ Native Google Ads integration ✅ Web + iOS + Android in one property ✅ Free at the standard tier |
| − | ❌ No native Google Ads push ❌ No cross-platform app SDK ❌ No BigQuery-shape raw export |
❌ 30-min Realtime card, not streaming ❌ Sampling above 10M events per query ❌ (other) row above cardinality limit ❌ 14-month retention cap ❌ Setup is a project |
The bottom line
GA4 is the right call in three narrow situations: you run paid acquisition through Google Ads and need native audience push and bid-side conversion import, you need web and native-app measurement in one property, or your warehouse is BigQuery and the raw event export is the foundation of your team's workflow.
For everyone else, WireBoard wins. A live count of concurrent visitors and the pages they are reading right now, streamed. Sixty-plus widgets, arranged around the way you read your numbers. A multi-site widget that shows your whole portfolio at once. SERP volatility and the Google-updates timeline on the same canvas as the rest of your analytics. A populated dashboard the minute you sign up. Three years of retention from $9. Every chart is the real count, with no sampling and no (other) row. And no two-state tier model: there is one feature set on every plan, including the free one.
Start tracking for free with WireBoard. 50,000 pageviews per month, 2 websites, 3 dashboards, every feature included. No credit card. No trial period. No catch.
Sources
WireBoard
- WireBoard homepage
- WireBoard pricing
- WireBoard features
- SERP volatility live tool
- Google Core and Spam Updates timeline
- WireBoard product timeline and changelog
- WireBoard privacy policy
- WireBoard documentation
Google Analytics 4 (where the claims about their product are grounded)
- GA4 Realtime report documentation
- GA4 data sampling documentation
- GA4 (other) row documentation
- GA4 BigQuery export documentation
- Google Analytics 360 product page
EU data protection and infrastructure