

Which should you pick: WireBoard or Mixpanel?
The two tools answer different jobs and bill on different units. Both can answer a slice of the other's question. Only one is built for it.
Pick Mixpanel if your work happens inside a logged-in product where every click, screen view, and feature use is an event you instrument in code; if your team thinks in cohorts, funnels stretched over weeks, and retention curves; if you need session replay, experiment reporting, or feature flags sitting next to your analytics; or if a US-built platform with optional EU data residency in the Netherlands is acceptable for your data posture.
Pick WireBoard if your work happens on a website you watch live: launches, ad blasts, news cycles, algorithm-rumble mornings, flash sales, agency portfolios. Pick it if you want a streaming live dashboard you compose from 60+ widgets across multiple sites, an SEO suite that names today's SERP turbulence and Google update timing, and pageview-based pricing where every feature is unlocked at every tier including the permanent free plan.
Read on for the scoreboard, the three decisions that pull the choice apart, where Mixpanel wins outright, where WireBoard wins outright, the pricing math (and the apples-to-oranges trap inside it), and a way to put both on a real site before deciding.
At a glance
| WireBoard | Mixpanel | |
|---|---|---|
| Native subject of measurement | Website visitors and what they did on the site | Product users and the events they fired in your code |
| Real-time surface | Streaming live widgets, real-time funnels, live event feed | Boards auto-refresh every 10 minutes in TV mode; an Events View streams raw events for debugging |
| Setup work | One script tag, two minutes | SDK install plus event instrumentation in your codebase |
| Dashboards | 60+ widgets, drag-and-drop, multiple per site, three themes, populated default | Boards composed of report cards; templates available |
| Multi-site live aggregation | Yes, in one widget | Not a native concept; projects are per-app |
| SEO suite (SERP volatility, Google updates) | Included on every plan | Not offered |
| Cohort analysis, retention curves, behavioral cohorts | Not offered | Yes (limited on Free, fuller on Growth/Enterprise) |
| Session replay | Not offered | Yes (10K/mo Free, 20K/mo Growth) |
| Experiment reporting and feature flags | Not offered | Add-on |
| Read-only public API | Yes (REST + Live SSE at api.wireboard.io, official JS and Python SDKs, MCP server for LLM agents) |
Yes (Query API on Growth+; Ingestion and Export APIs on all plans) |
| Permanent free plan | Yes, every feature, 50k PV/mo | Yes, capped at 1M events/mo, 5 saved reports per seat |
| Entry-point price (after free) | $9/mo (Micro): 100k PV, 50 sites, 3 seats | $0.28 per 1K events on Growth, after the first 1M free |
| Indicative price at high volume | $49/mo at 1M pageviews (Large) | About $2,520/mo at 10M events on Growth |
| Hosting and data path | Full in-house pipeline on EU infrastructure | US by default; EU data residency option (Netherlands) on every plan |
| Pricing unit | Pageviews per month | Events per month |
They look like they answer the same question. They don't.
Most comparison posts line WireBoard and Mixpanel up because both produce charts, both track conversions, and both ship a "web analytics" page. Side by side on a feature list, they look like the same shape of tool.
The shape is similar. The subject is not. WireBoard is built around the website as the object of measurement: pages, sessions, referrers, countries, devices, custom events tied to the site. Mixpanel is built around the user as the object of measurement: a person identified across sessions and devices, joined to a profile, threaded through a product as a stream of events the developer fires from code. Mixpanel also markets a Web Analytics offering framed around website performance, and it works, but it sits on top of the same event and user model that powers the rest of the platform. The platform's center of gravity is the product, not the site.
Once you accept that the subject is different, the rest of the comparison rearranges. The pricing units rearrange (events vs pageviews). The dashboard model rearranges (live widgets vs report boards). The setup work rearranges (one script tag vs instrumented events). Three decisions cleanly separate them.
Three decisions that pull the two products apart
I have used both. I run WireBoard. The three differences below are not abstract design philosophies. They show up the moment you sit down to use either tool.
1. Which subject is the dashboard about: the site, or the user?
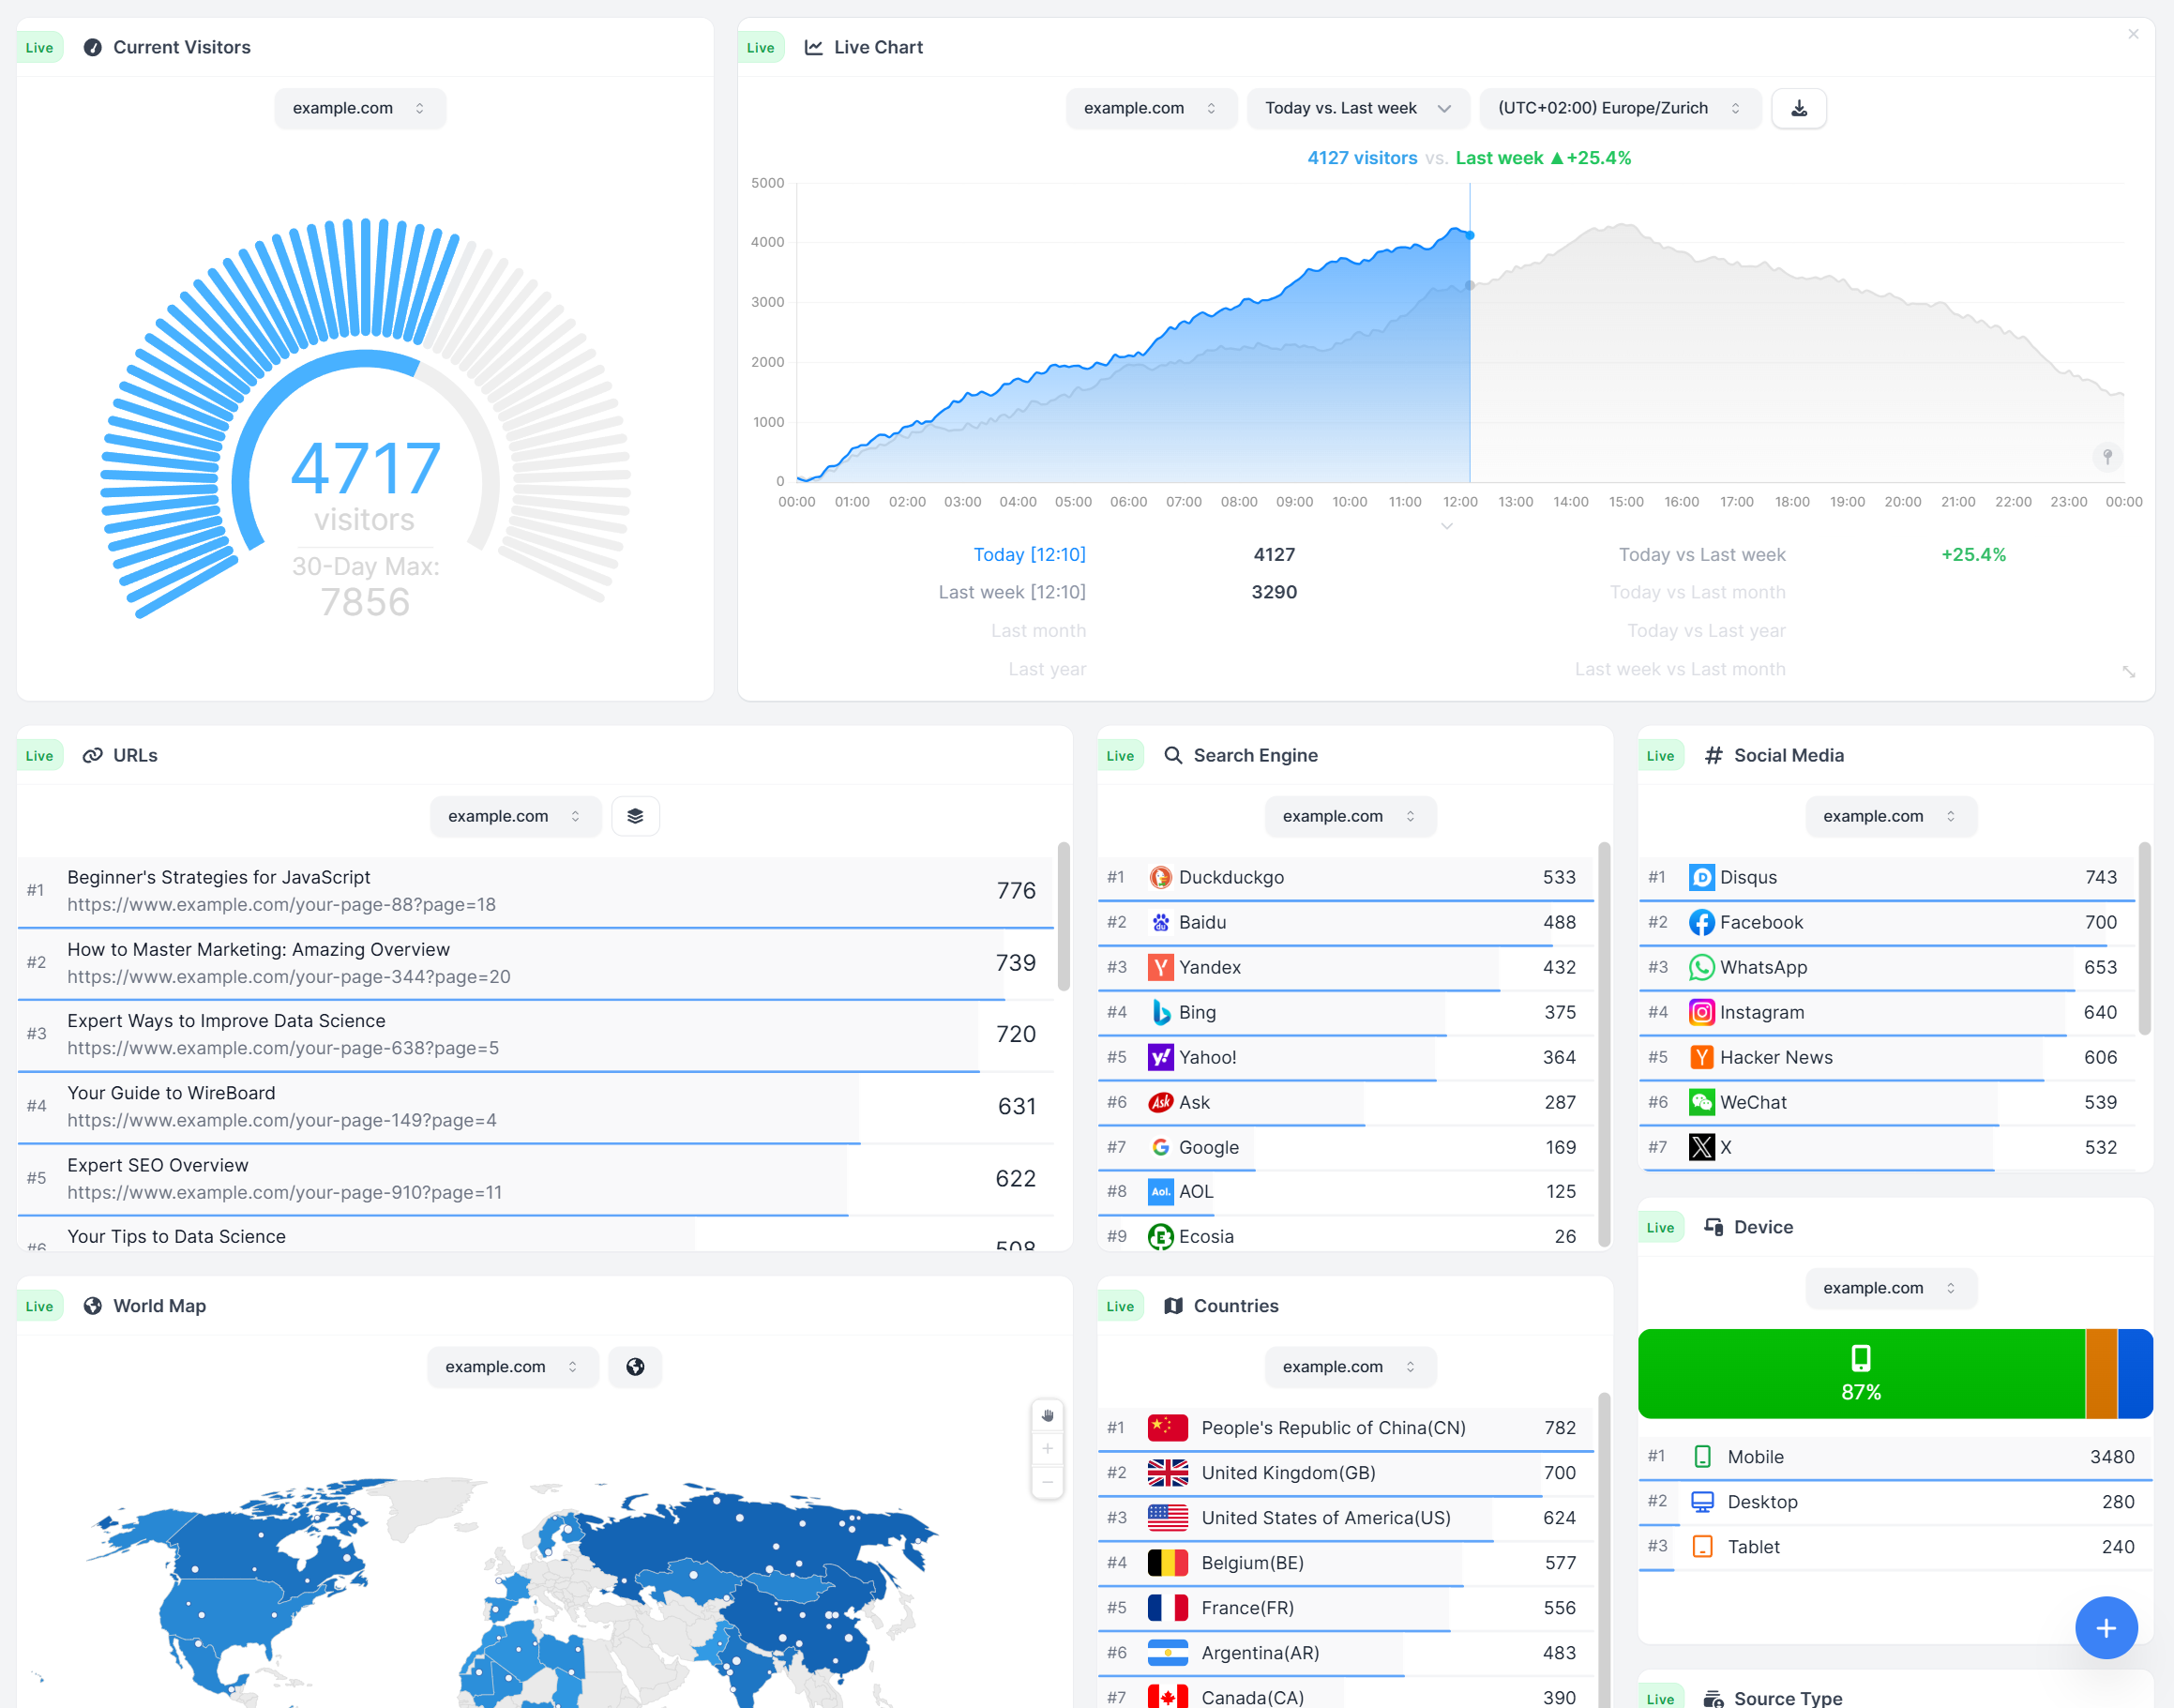
Open WireBoard. The first screen is a populated default dashboard that reads as a site overview: live concurrent visitors, the live view of which pages they are reading, the world map, traffic sources, devices, the top pages of the day. The next click drops in a real-time funnel, a UTM campaign feed, a goal with revenue by plan tier, or a SERP volatility widget. The unit is the visit and the page. The grain is the site.
Open Mixpanel and the first screen is a Board of report cards built around events and users. Add a Funnels report, a Retention report, a Cohorts breakdown, a Flows view of how a user moved through screens. The unit is the event you fired in code and the user it is tied to. The grain is the product session. You can still answer "how many people visited my blog post yesterday," but you answer it by querying a pageview event in a product-analytics shaped tool, not by glancing at a board that was built to show it.
The honest read: if your work is a website (content site, ecommerce store, agency portfolio, marketing site, SaaS landing pages, anything where the visitor is the thing you care about), WireBoard's defaults match your workflow on day one. If your work is a product where logged-in user behavior is the question and the website is one surface among several (mobile app, embedded experiences, internal flows), Mixpanel's defaults match yours. Forcing either tool into the other's job is doable. It is rarely happy.
2. How fresh does the dashboard have to be?
WireBoard streams. Two hero widgets carry the message: a real-time count of concurrent visitors on the site, alongside a live view listing the URLs they are reading. Around them sit the world map, the traffic sources panel, the device breakdown, real-time funnels, and the rest of the 20+ live widgets named on WireBoard's features page. A visit lands; the dashboard shows it. A custom event fires; the live event feed scrolls. The pipeline (collection, processing, storage, and dashboards) is built and operated by WireBoard end to end on EU infrastructure, so the live path is not throttled by a third-party ingestion service.
Mixpanel takes a different approach. The standard surface is a Board of report cards, and Mixpanel's docs describe Boards as auto-refreshing every 10 minutes in TV mode. Reports use cached results that vary with the query date range. There is a separate Events View (formerly Live View) that, in Mixpanel's own words, "displays events coming into your Mixpanel project in real time" and is "an extremely useful tool for testing changes to your implementation, debugging or QA testing." It streams raw events; it is positioned as an implementation-debugging tool, not the main dashboard you watch during a launch.
That is a real difference for one kind of work and irrelevant for another. If you are checking analytics once a week before a meeting, ten-minute refresh is plenty. If you watch a tab during ad spends, news cycles, or algorithm panic days, "watch the dashboard tell me what is happening right now" is the entire job.
3. What you assemble vs what you instrument
Setup looks different because the products ask for different work up front.
WireBoard installs as one script tag. After that, pageviews flow, referrers flow, sources flow, devices flow, geography flows. A first dashboard is already populated by a sensible default template. Custom events sit on top with a one-line JavaScript call, automatic UTM capture, and a numeric value field for revenue. You start by reading; you instrument the specific events you care about as you go.
Mixpanel installs an SDK and asks you to model the product as a list of events. The instrumentation pays off enormously once it is in place, because every Mixpanel report (Funnels, Retention, Cohorts, Flows, Insights) reads from that event stream. Nothing is free; everything is what you defined. For a logged-in product where you control the codebase and can ship instrumentation alongside features, that work is the price of admission and the reason the analytics get sharp. For a content site, an agency portfolio, or a WordPress install where you want to know what is happening on the site without an engineering project, it is a heavier lift than the question warrants.
What Mixpanel does better than WireBoard today
Real gaps, not marketing-line gaps. If any of these are critical for your team, Mixpanel is the better pick.
Cohort analysis and retention curves. Mixpanel's Cohorts and Retention reports are the headline jobs the product was built around. Save a behavioral cohort once and reuse it across every report. Plot N-day, weekly, or monthly retention curves. Slice by user property. WireBoard does not ship a cohort-analysis or retention-curve report. For a SaaS team asking "of the users who signed up in week 23, how many came back in week 30," that is Mixpanel.
User-level identity stitched across sessions and devices. Once a user logs in and you call Mixpanel's identify method, that user's events stitch together across browsers, mobile sessions, and time. WireBoard's model is session-based by design (visitor analytics, not user analytics).
Session replay on every paid plan, with a free tier of replays. Mixpanel includes 10K monthly session replays on the Free plan and 20K on Growth and Enterprise per their pricing page. WireBoard does not ship session replay.
Experiment reporting and feature flags as add-ons. Sit beside the analytics on the same platform. Useful if A/B testing is part of how your team ships.
Deeper analyst surface. Behavioral cohorts, impact and statistical significance reports, anomaly detection on Growth, root cause analysis and cross-product analytics on Enterprise, the Spark AI query builder for natural-language queries against the event stream. If a dedicated analyst is reading the dashboard, the Mixpanel surface gives them more to work with.
Direct data warehouse connectors out of the box. Mixpanel publishes Ingestion, Export, and Query APIs; the Query API is available on Growth and Enterprise per Mixpanel's pricing page, and data warehouse connectors are included on Growth and above. WireBoard now ships its own public API at api.wireboard.io (read-only REST plus a Live Server-Sent Events stream), with official JavaScript (@wireboard/api) and Python (wireboard-api) SDKs and an MCP server for LLM agents, alongside the existing one-line event API for sending data in and scheduled exports to S3, FTP, or SFTP. First-party warehouse connectors (Snowflake, BigQuery, and similar) are not yet shipped — you'd pipe data in yourself via the REST API.
Enterprise governance. SAML-based SSO, SCIM provisioning, project-level and report-level roles, sensitive data classification, HIPAA compliance tools, customizable data retention policies. Those sit on Mixpanel's Enterprise tier and are not in WireBoard's current scope.
Brand maturity in the product-analytics category. Mixpanel has been shipping product analytics since 2009 and serves a large customer base of product teams. If "the team has already worked with Mixpanel and the muscle memory is there," that is a real switching cost.
What WireBoard offers that Mixpanel doesn't
The reverse direction, kept to gaps that are visible in both products' public documentation today.
A streaming live surface, not a ten-minute refresh. Concurrent visitors right now, the pages they are looking at, the world map, the traffic source panel, the device breakdown, and live real-time funnels each push forward as events land. Long-range reports sit on stored data the same way any analytics tool's history view does. With WireBoard the streaming surface is the product; the equivalent live feed in Mixpanel lives inside an implementation-debugging tool, not the dashboard most teams open.
Portfolio-wide live aggregation in one widget. Point a single widget at any selection of your sites and it merges their live traffic into one stream, or filter to one and watch just that. For an agency, a publisher group, or a multi-brand operator, this collapses a daily ritual of checking five tabs into a glance. Mixpanel scopes projects per app or per site by design; cross-project aggregation is not a native dashboard concept.
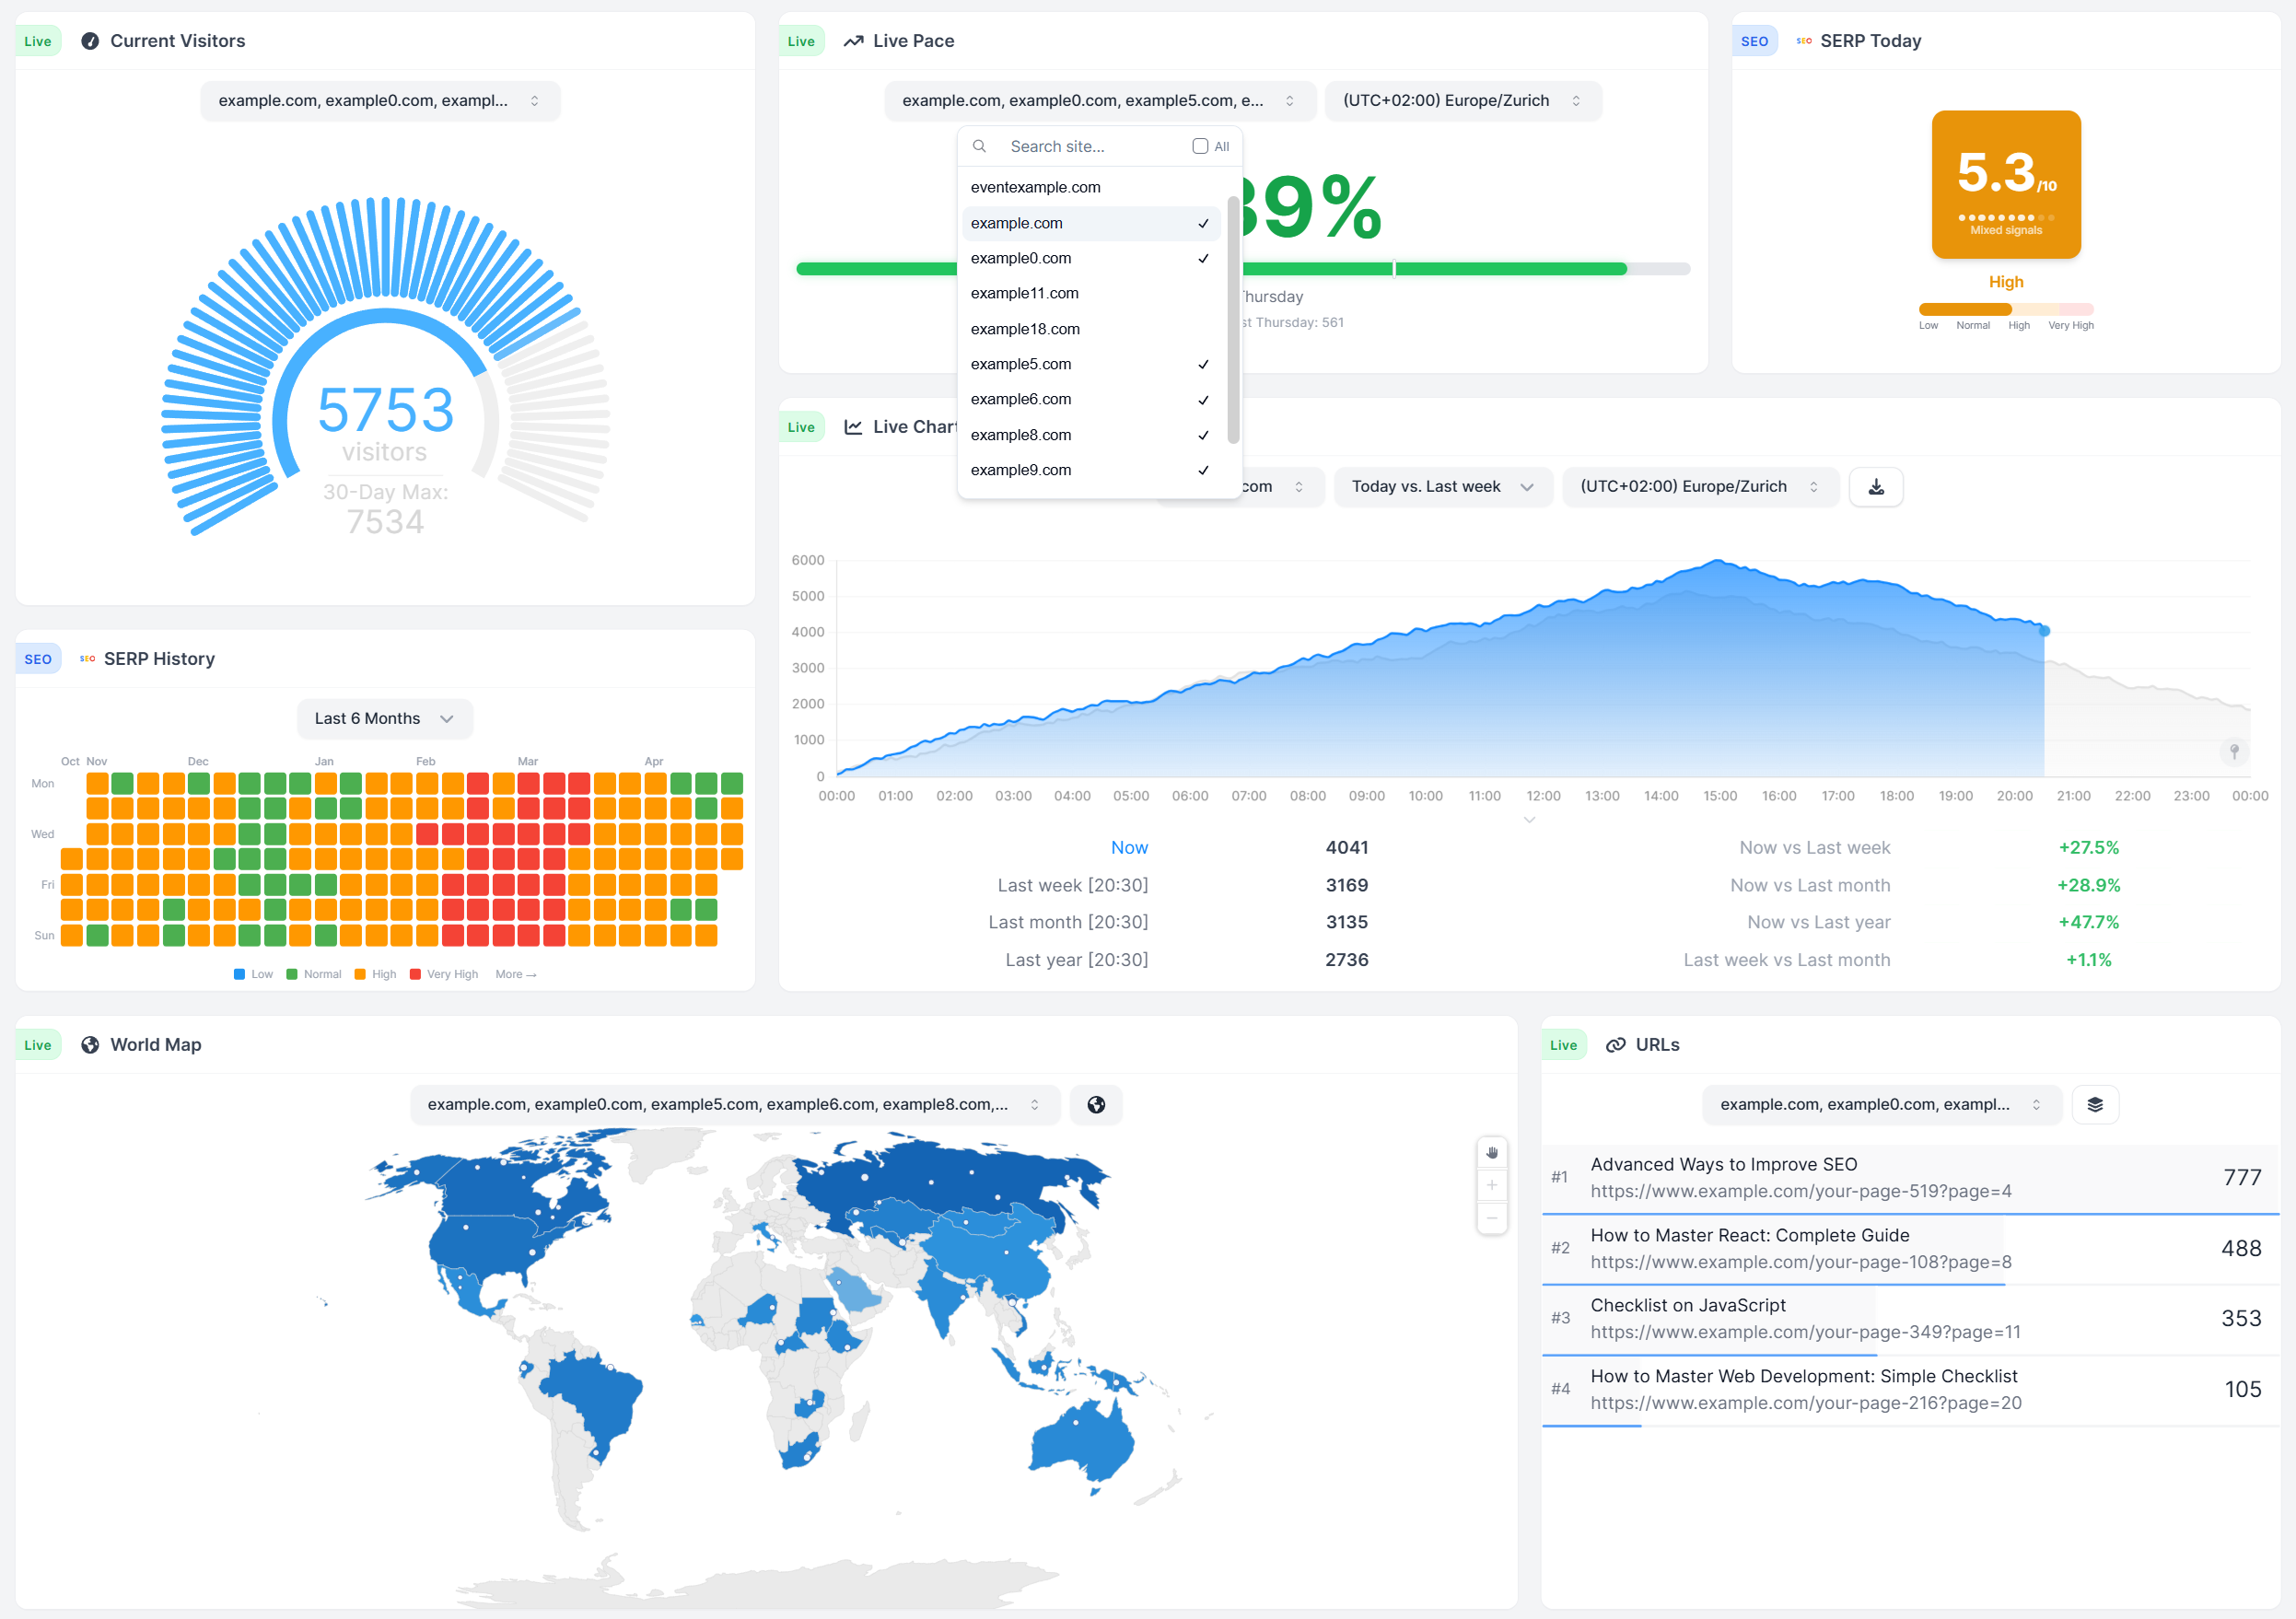
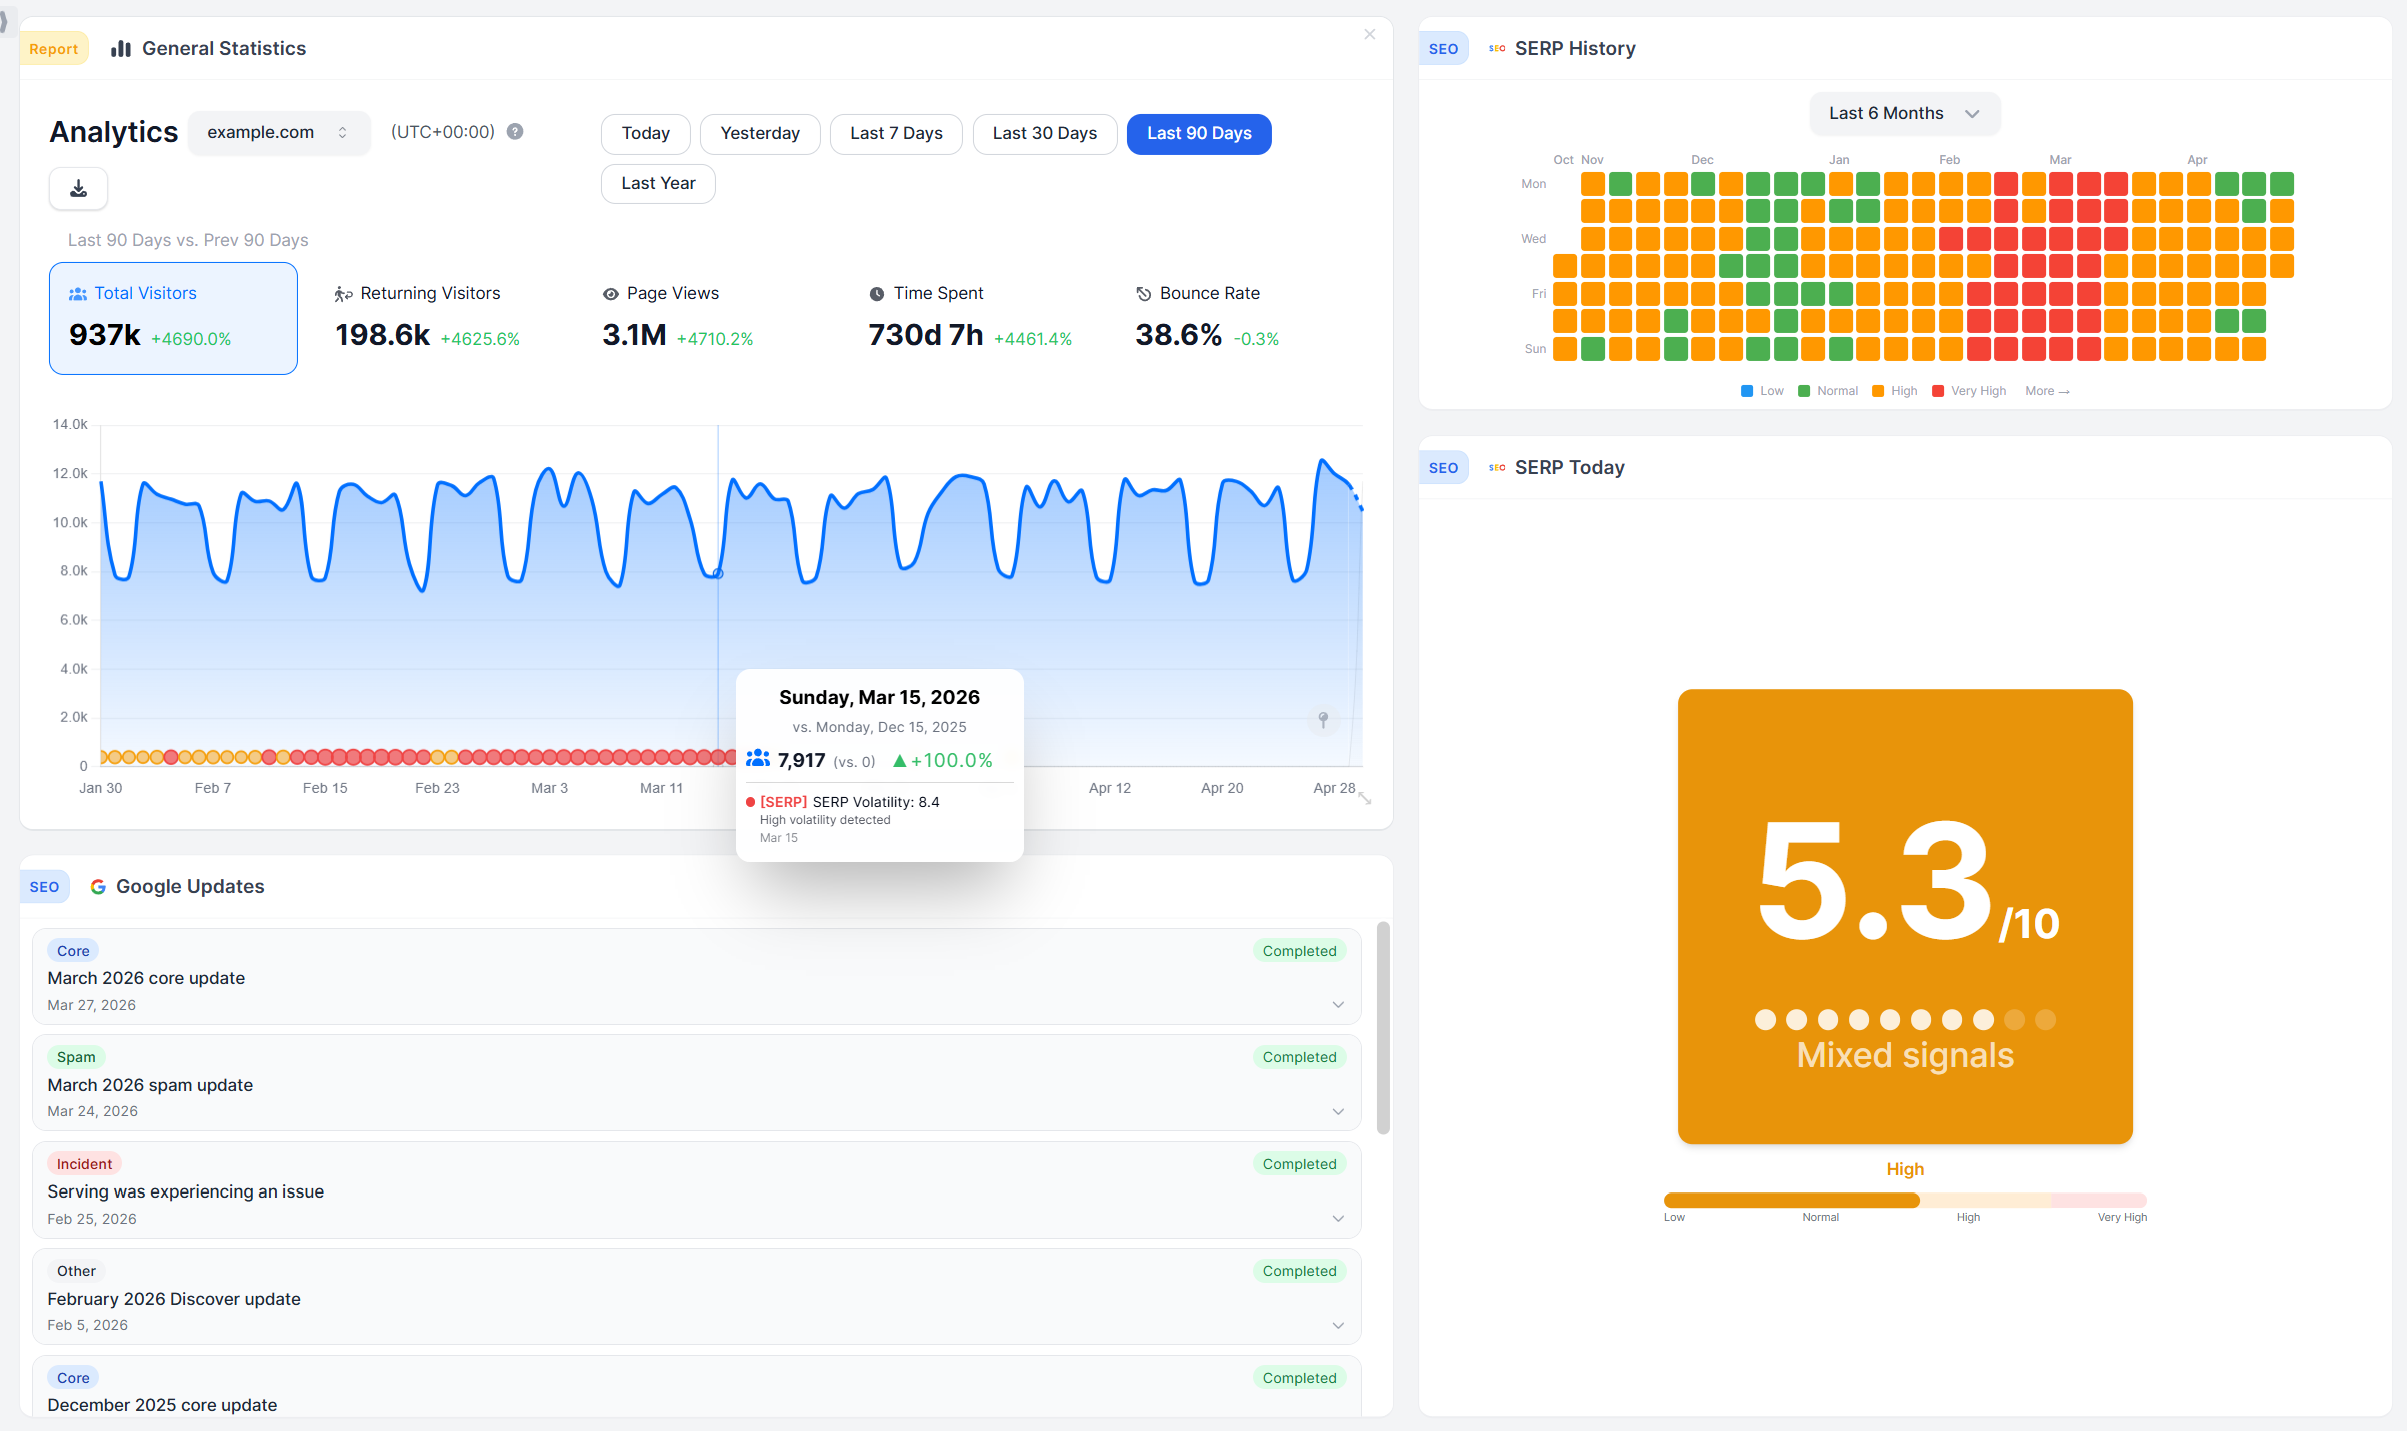
SERP Volatility live dashboard, Google Core and Spam Updates timeline, and a per-country holiday annotation overlay. Mixpanel does not ship anything that places SEO context next to your visitor charts. For a content site or any business whose traffic depends on Google, this is the morning-after difference between a thirty-second briefing and an hour of guessing.
Dashboards built from 60+ independent widgets across three themes and any number of boards per site. WireBoard's surface composes from widgets you arrange yourself. Mixpanel's surface composes from report cards on a Board. Two valid shapes of customization, pointed at two different problems.
A layered annotations system on every time-axis chart. Built-in layers for your own events, WireBoard global events, Google Updates, SERP Volatility, and per-country Public Holidays, plus per-user notes. Mixpanel does not ship a comparable overlay system.
Streamer Mode and a one-keystroke screenshot. Streamer Mode blurs URLs, domains, and titles before you screen share or record a demo; a Shift+C keypress drops the whole dashboard to a PNG. Both are baked into the surface, not bolted on.
A pricing model where every WireBoard plan, free included, carries every feature. Real-time funnels. Revenue per goal. Custom event properties. The SEO suite. Multi-site live aggregation. Embed tokens. Streamer Mode. Three years of retention on every paid plan. Nothing reserved for a higher tier; the only thing that scales is volume.
Full pipeline run end-to-end on EU infrastructure. Collection, processing, storage, and dashboards all on WireBoard's own EU stack. No third-party ingestion services. Mixpanel offers an EU Data Residency option on every plan that stores and processes data in their Netherlands data center; on the standard US setup, data lives in the US.
WireBoard as a Mixpanel alternative: where it overlaps and where it doesn't
These two tools sit in different categories. Mixpanel is product analytics: events your engineers instrument in code, cohorts, retention curves, session replay, feature flags, experiments. WireBoard is web analytics: streaming live widgets that show who is on the site right now, dashboards you build yourself across sixty-plus widgets and multiple boards per site, multi-site live aggregation in one widget, real-time funnels with revenue per goal property, and an SEO suite (SERP volatility, Google update timeline) on the same screen as your traffic.
WireBoard's lead is live data. The visitor counter, the world map, traffic sources, and the event feed all stream the moment a hit lands. When a launch goes live, a tweet sends traffic, or a Google update starts rumbling, you see it streaming, not waiting on a periodic refresh. Around that streaming core: more than sixty drag-and-drop widgets, multiple dashboards per site, three themes, and a populated default template the minute you sign up.
So "WireBoard as a Mixpanel alternative" depends on which surface you actually measure. If your job is the website (launches, ad blasts, news cycles, algorithm-rumble mornings, agency portfolios), WireBoard is the answer; every paid feature ships on every paid tier, and the permanent Free Plan covers 50,000 page views on two sites and three boards. If your job is the in-app product, WireBoard is not what you want and Mixpanel still wins.
Should you trust this comparison?
Fair question. Here is where I am coming from.
I run WireBoard. I have used Mixpanel on past projects, re-read their pricing page, docs, and reports overview for this post, and watched teams pick the right tool the second time after trying the wrong one first. What follows is what I tell prospects who ask which one fits. Where Mixpanel fits the work, I will say so. Where WireBoard fits it, I will say that too, and every factual claim points at a public source.
Two more things to weigh.
Verifiability. Each Mixpanel statement above points at a Mixpanel-controlled page (pricing, docs, developer reference, help center, EU residency page) reachable from the Sources block. Each WireBoard statement points at a feature that exists in the product today. Anything that is on our roadmap and not yet shipped is called out as such (native Slack-channel reporting and configurable traffic-spike alerts are on the roadmap; today, they are real gaps).
Customer signal. WireBoard's named users watch website traffic live for a living: Barry Schwartz at Search Engine Roundtable covers Google algorithm rollouts daily, Robert Farrington at The College Investor runs a high-traffic content brand, and Jon James runs TeamGreet. None of them picked WireBoard because they could not find a product-analytics platform. They picked the tool that matches the website-shaped job they show up to do.
How the pricing actually plays out
Prices below were recorded from each company's published pricing page in May 2026. Both Mixpanel and WireBoard adjust pricing periodically. Before making a buying decision, verify current rates on the Mixpanel pricing page and the WireBoard pricing page.
The two pricing models reflect the two product shapes. Mixpanel bills by event volume; the more events your product fires, the higher the bill. WireBoard bills by pageview quota; the bigger your site's traffic, the higher the tier. Comparing them straight across is an apples-to-oranges exercise. The honest read is to look at both philosophies and to translate your own situation through them.
Mixpanel's tiers
Mixpanel publishes three plans on its pricing page, with the current event-based billing model.
| Mixpanel plan | Entry price | Events/mo | Notable inclusions |
|---|---|---|---|
| Free | $0 | Up to 1,000,000 | 5 saved reports per seat, 10K session replays per month, GDPR/CCPA/SOC 2 compliance, US or EU data residency |
| Growth | Starts at $0 (1M events free) then $0.28 per 1K events | Up to 20,000,000 | Unlimited saved reports, 20K session replays, behavioral cohorts, impact and statistical significance, anomaly detection, Query API access, data warehouse connectors, monitoring and alerts |
| Enterprise | Custom (contact sales) | Up to 1 trillion | Adds report-level roles, SAML SSO and SCIM, HIPAA tools, customizable data retention, dedicated account manager, 24/7 support, premium analytics features |
Sample Growth costs at common event volumes (from the Mixpanel pricing calculator on their pricing page): about $280/mo at 2M events, about $1,120/mo at 5M events, about $2,520/mo at 10M events. Enterprise contracts are negotiated and not published.
WireBoard's tiers
WireBoard ships nine plans, starting at $0 forever. Yearly billing saves about 17%. Every paid tier includes every feature, every dashboard, every integration.
| WireBoard plan | Monthly | Pageviews/mo | Sites | Dashboards | Team seats | History |
|---|---|---|---|---|---|---|
| Free Plan | $0 | 50,000 | 2 | 3 | 1 | 30 days |
| Micro | $9 | 100,000 | 50 | 100 | 3 | 3 years |
| Small | $19 | 250,000 | 50 | 100 | 5 | 3 years |
| Medium | $24 | 500,000 | 50 | 100 | 10 | 3 years |
| Large | $49 | 1,000,000 | 50 | 100 | 15 | 3 years |
| Extra Large | $99 | 3,000,000 | 50 | 100 | 20 | 3 years |
| Pro | $199 | 6,000,000 | 50 | 100 | 30 | 3 years |
| Pro Plus | $399 | 12,000,000 | 100 | 200 | 50 | 3 years |
| Enterprise | Custom | Custom | Unlimited | Unlimited | Unlimited | Custom |
The unit problem and a fair side-by-side
A pageview in WireBoard and an event in Mixpanel are not the same accounting unit. A single visitor reading one page produces one pageview in WireBoard. The same visitor in a Mixpanel-instrumented product can produce many events (page loaded, button clicked, modal opened, form submitted, video played), depending on how the product is instrumented. For a site that does only basic instrumentation, one pageview is roughly one event. For a site with rich event tracking, one pageview may translate to three, five, or more Mixpanel events.
The table below sets the two products side by side on a website-analytics workload with one event per pageview as the baseline.
| Monthly volume | WireBoard | Mixpanel Growth (per pricing calculator) | Notes |
|---|---|---|---|
| 50,000 visits | Free | Free (under 1M event cap) | Both fit the free tier on a basic-instrumentation read |
| 100,000 visits | $9/mo (Micro) | Free (under 1M event cap) | Mixpanel cheaper at low volume only if you stay near 1 event per pageview |
| 1,000,000 visits | $49/mo (Large) | About $0 to $280/mo | Mixpanel free at exactly 1M events, then $0.28 per 1K |
| 6,500,000 visits | $199/mo (Pro covers up to 6M; $399/mo at Pro Plus) | About $1,540/mo on Growth | WireBoard is roughly 8x to 10x cheaper at this volume on a per-pageview workload |
| 10,000,000 events with rich instrumentation | $199 to $399/mo if pageviews stay within Pro or Pro Plus | About $2,520/mo on Growth | The gap widens the more your team instruments |
That second-to-last and last row are where the pricing-model difference shows up. Mixpanel is competitive at the bottom of the volume curve, particularly under 1 million events. As event volume climbs, the bill scales linearly with how much your product instruments, and the math turns against an event-based model for a website workload. WireBoard's per-pageview rate gets cheaper, not more expensive, the further you go.
Three differences that move the buying decision
- Mixpanel ships things WireBoard does not: session replay, cohorts, retention curves, A/B reporting (add-on), feature flags (add-on), SAML SSO, HIPAA tools, warehouse connectors. If any of those are part of how your team works, the price comparison is moot.
- WireBoard ships things Mixpanel does not for the website job: streaming live widgets, multi-site live aggregation, SEO suite, on-chart annotations, every feature unlocked at every tier including the permanent free plan. If those are part of how your team works, the price comparison is moot in the other direction.
- The bill scales on different inputs. Mixpanel scales with how much you instrument. WireBoard scales with how much traffic you serve. Two teams with identical website volume can land in dramatically different positions on each tool's bill depending on how event-heavy their instrumentation is.
Don't decide on theory. Install both.
Reading reviews is the slow path. Putting both dashboards on the same screen is the fast one. Web analytics tools watch traffic that is already happening; there is no experiment to design, just two surfaces sitting side by side, reading the same site.
Mixpanel's Free plan starts at zero with 1 million events per month. WireBoard's Free Plan is permanent, every feature, 50,000 pageviews per month, no credit card. Both install on a real site without commitment.
- Stand up both on one real site. Drop in WireBoard's script tag (about two minutes). Install Mixpanel's SDK and instrument at least a pageview event plus one or two events that matter to your work.
- Read each one on a busy moment. Run a small ad, share a post, ship a launch, or wait for organic traffic. Note which dashboard you would actually want open in a tab while it is happening.
- Try to answer one question that decides your work. "Which UTM campaign drove the most signups today?" "What is the funnel completion rate by country for users who arrived from a Google update day?" "Is my site healthy right now?" Whichever tool gets the answer faster wins on your specific job.
The three differences above stop being abstract the moment both dashboards are reading the same traffic.
Pros and cons at a glance
| WireBoard | Mixpanel | |
|---|---|---|
| + | ✅ True real-time, streaming live ✅ 60+ widgets, fully customizable ✅ Multi-site live in one view ✅ SERP volatility + Google update tracking ✅ Every feature on every plan, even free |
✅ Cohorts and retention curves ✅ Session replay on every plan ✅ A/B and feature flags (add-on) |
| − | ❌ No cohort or retention reports ❌ No session replay ❌ Higher raw cost at low event volumes |
❌ Boards refresh every 10 minutes ❌ Heavy instrumentation work upfront ❌ No multi-site live aggregation ❌ No SEO / Google-update tracking ❌ Higher raw cost at high pageview volumes |
The bottom line
Mixpanel is the right pick in three narrow situations: your work is product analytics on a logged-in app where users are the unit and events are the grain, your team relies on cohorts, retention math, session replay, A/B testing, or feature flags as part of the analytics workflow, or you need enterprise governance like SAML SSO and HIPAA compliance tools that sit on Mixpanel's Enterprise tier.
For everyone whose work is the website itself, WireBoard is the answer. Live traffic that streams as it arrives. The concurrent-visitor count and the live page reader as the two hero widgets, the world map and the rest of the live surface sitting around them. Cross-site live aggregation that turns a portfolio of sites into one widget. SERP volatility, Google update timing, and per-country holiday context layered onto the same charts your traffic lives on. Drag-and-drop dashboards, multiple per site, in light, dark, or future themes. And a pricing model where every tier carries every feature, including the permanent free one. No upgrade gate on funnels, on revenue per goal, on multi-site aggregation, or on the SEO suite. No asterisks.
Start tracking for free with WireBoard. 50,000 pageviews per month, 2 websites, 3 dashboards, every feature included. No credit card. No trial period. No catch.
Sources
WireBoard
- WireBoard homepage
- WireBoard pricing
- WireBoard features
- SERP volatility live tool
- Google Core and Spam Updates timeline
- WireBoard product timeline and changelog
- WireBoard privacy policy
- WireBoard documentation
Mixpanel (where the claims about their product are grounded)