

Which should you pick: WireBoard or PostHog?
PostHog is a developer platform: product analytics, web analytics, session replay, feature flags, A/B testing, surveys, error tracking, a data warehouse, all under one roof. WireBoard is a real-time web analytics platform: see who is on your site right now, on dashboards you arrange yourself, with the entire pipeline running in-house on EU infrastructure.
Pick PostHog if you build a SaaS or web app, watch users move through specific in-product features, ship A/B tests behind feature flags, replay individual sessions when bug reports come in, or pull product, web, and warehouse data into a single query layer.
Pick WireBoard if your job is the website itself: which article is trending right now, where the traffic is coming from, how a campaign or launch is landing the moment it goes live, whether a Google update is shaking your rankings today, and how multiple sites perform side by side.
Read on for the scoreboard, the category mismatch most reviews skip, three buyer profiles, where each tool wins, the pricing math, and how to call it yourself.
At a glance
| WireBoard | PostHog | |
|---|---|---|
| Product category | Web analytics platform | Developer platform (product + web analytics, session replay, feature flags, experiments, surveys, warehouse) |
| Real-time on web analytics | Streaming live widgets: live visitor counter, live pages, world map, traffic sources, device breakdown, real-time funnels | Live tab currently in alpha, stream of individual events from the last few minutes |
| Live concurrent-visitor counter | Yes, full day and beyond | Live event stream, no separate concurrent counter |
| Custom dashboards | 60+ widgets, drag and drop, multiple per site, three themes | Custom dashboards in Product Analytics (SQL access); Web Analytics dashboard is a fixed overview layout |
| Session replay | Not offered | Yes (web and mobile) |
| Feature flags + A/B testing | Not offered | Yes |
| Multi-site live aggregation | Yes, in a single widget | Project-per-site model |
| SEO suite (SERP volatility + Google update timeline) | Included on every plan | Not offered |
| Open source / self-hosting | No | Yes, MIT-licensed hobby deploy (paid-plan features are Cloud-only) |
| Free plan | Permanent, 50,000 page views/mo, 2 sites, 3 dashboards, every feature | 1,000,000 product analytics events/mo plus free tiers across other products, 1 project, 1-year retention |
| Data retention (paid) | 3 years | 7 years on events; 3 months on session recordings (Cloud) |
| Cookieless mode | One-switch toggle, cookies on by default for accuracy | Cookieless option available via configuration |
| EU-hosted | Yes, full pipeline in-house | Yes, Cloud EU in AWS Frankfurt |
| Public read API | Yes, REST + Live SSE stream, official JS and Python SDKs, MCP server | Yes, REST |
Two table notes. The free plan row reflects each product's headline limits, not a like-for-like comparison: PostHog meters events, WireBoard meters page views. The real-time row reflects PostHog's own docs, which state the Live tab is in alpha. Every claim is sourced at the bottom.
Why this is a category comparison, not a feature comparison
Most analytics comparisons open by lining up feature checklists. That works when the two products are in the same category. It does not work here, and reading WireBoard vs PostHog as a feature race is the fastest way to pick wrong.
PostHog markets itself, in its own words on its GitHub repository, as "an all-in-one developer platform for building successful products." The products on that platform: product analytics, web analytics, session replay, feature flags, experiments, surveys, error tracking, a data warehouse, a CDP, an AI product assistant, logs, and workflows. The center of gravity is the SaaS or web app. The buyer is usually a product engineer or a product manager.
WireBoard is a web analytics platform, full stop. The center of gravity is the website itself, and the buyer is usually a content owner, a marketing lead, an agency, or a publisher. Every feature around that center (60+ live and historical widgets, drag and drop dashboards, multi-site aggregation, the SEO suite, real-time funnels) is tuned to one question: what is happening on my site, right now and over time?
When two products are this differently scoped, the right question is not "which has more checkboxes." PostHog wins the checkbox race every time, because checking every box is the point of the platform. The right question is: which one matches the job in front of me?
Three buyer profiles. Find where you land.
I have watched the same three conversations play out over and over with people deciding between WireBoard and PostHog. The choice almost always sorts cleanly into one of these three profiles.
1. You run a website, not a product
Your job is the site itself: a content brand, a publisher, a marketing site for a SaaS company, an agency portfolio, a news network, an e-commerce storefront. You care about which page is trending right now, where the traffic is coming from, what a campaign is doing, whether a launch is converting, and whether a Google algorithm update just landed. You may or may not be a developer. Either way, you do not want to spend your week wiring autocapture rules or paying for session replay you will never open.
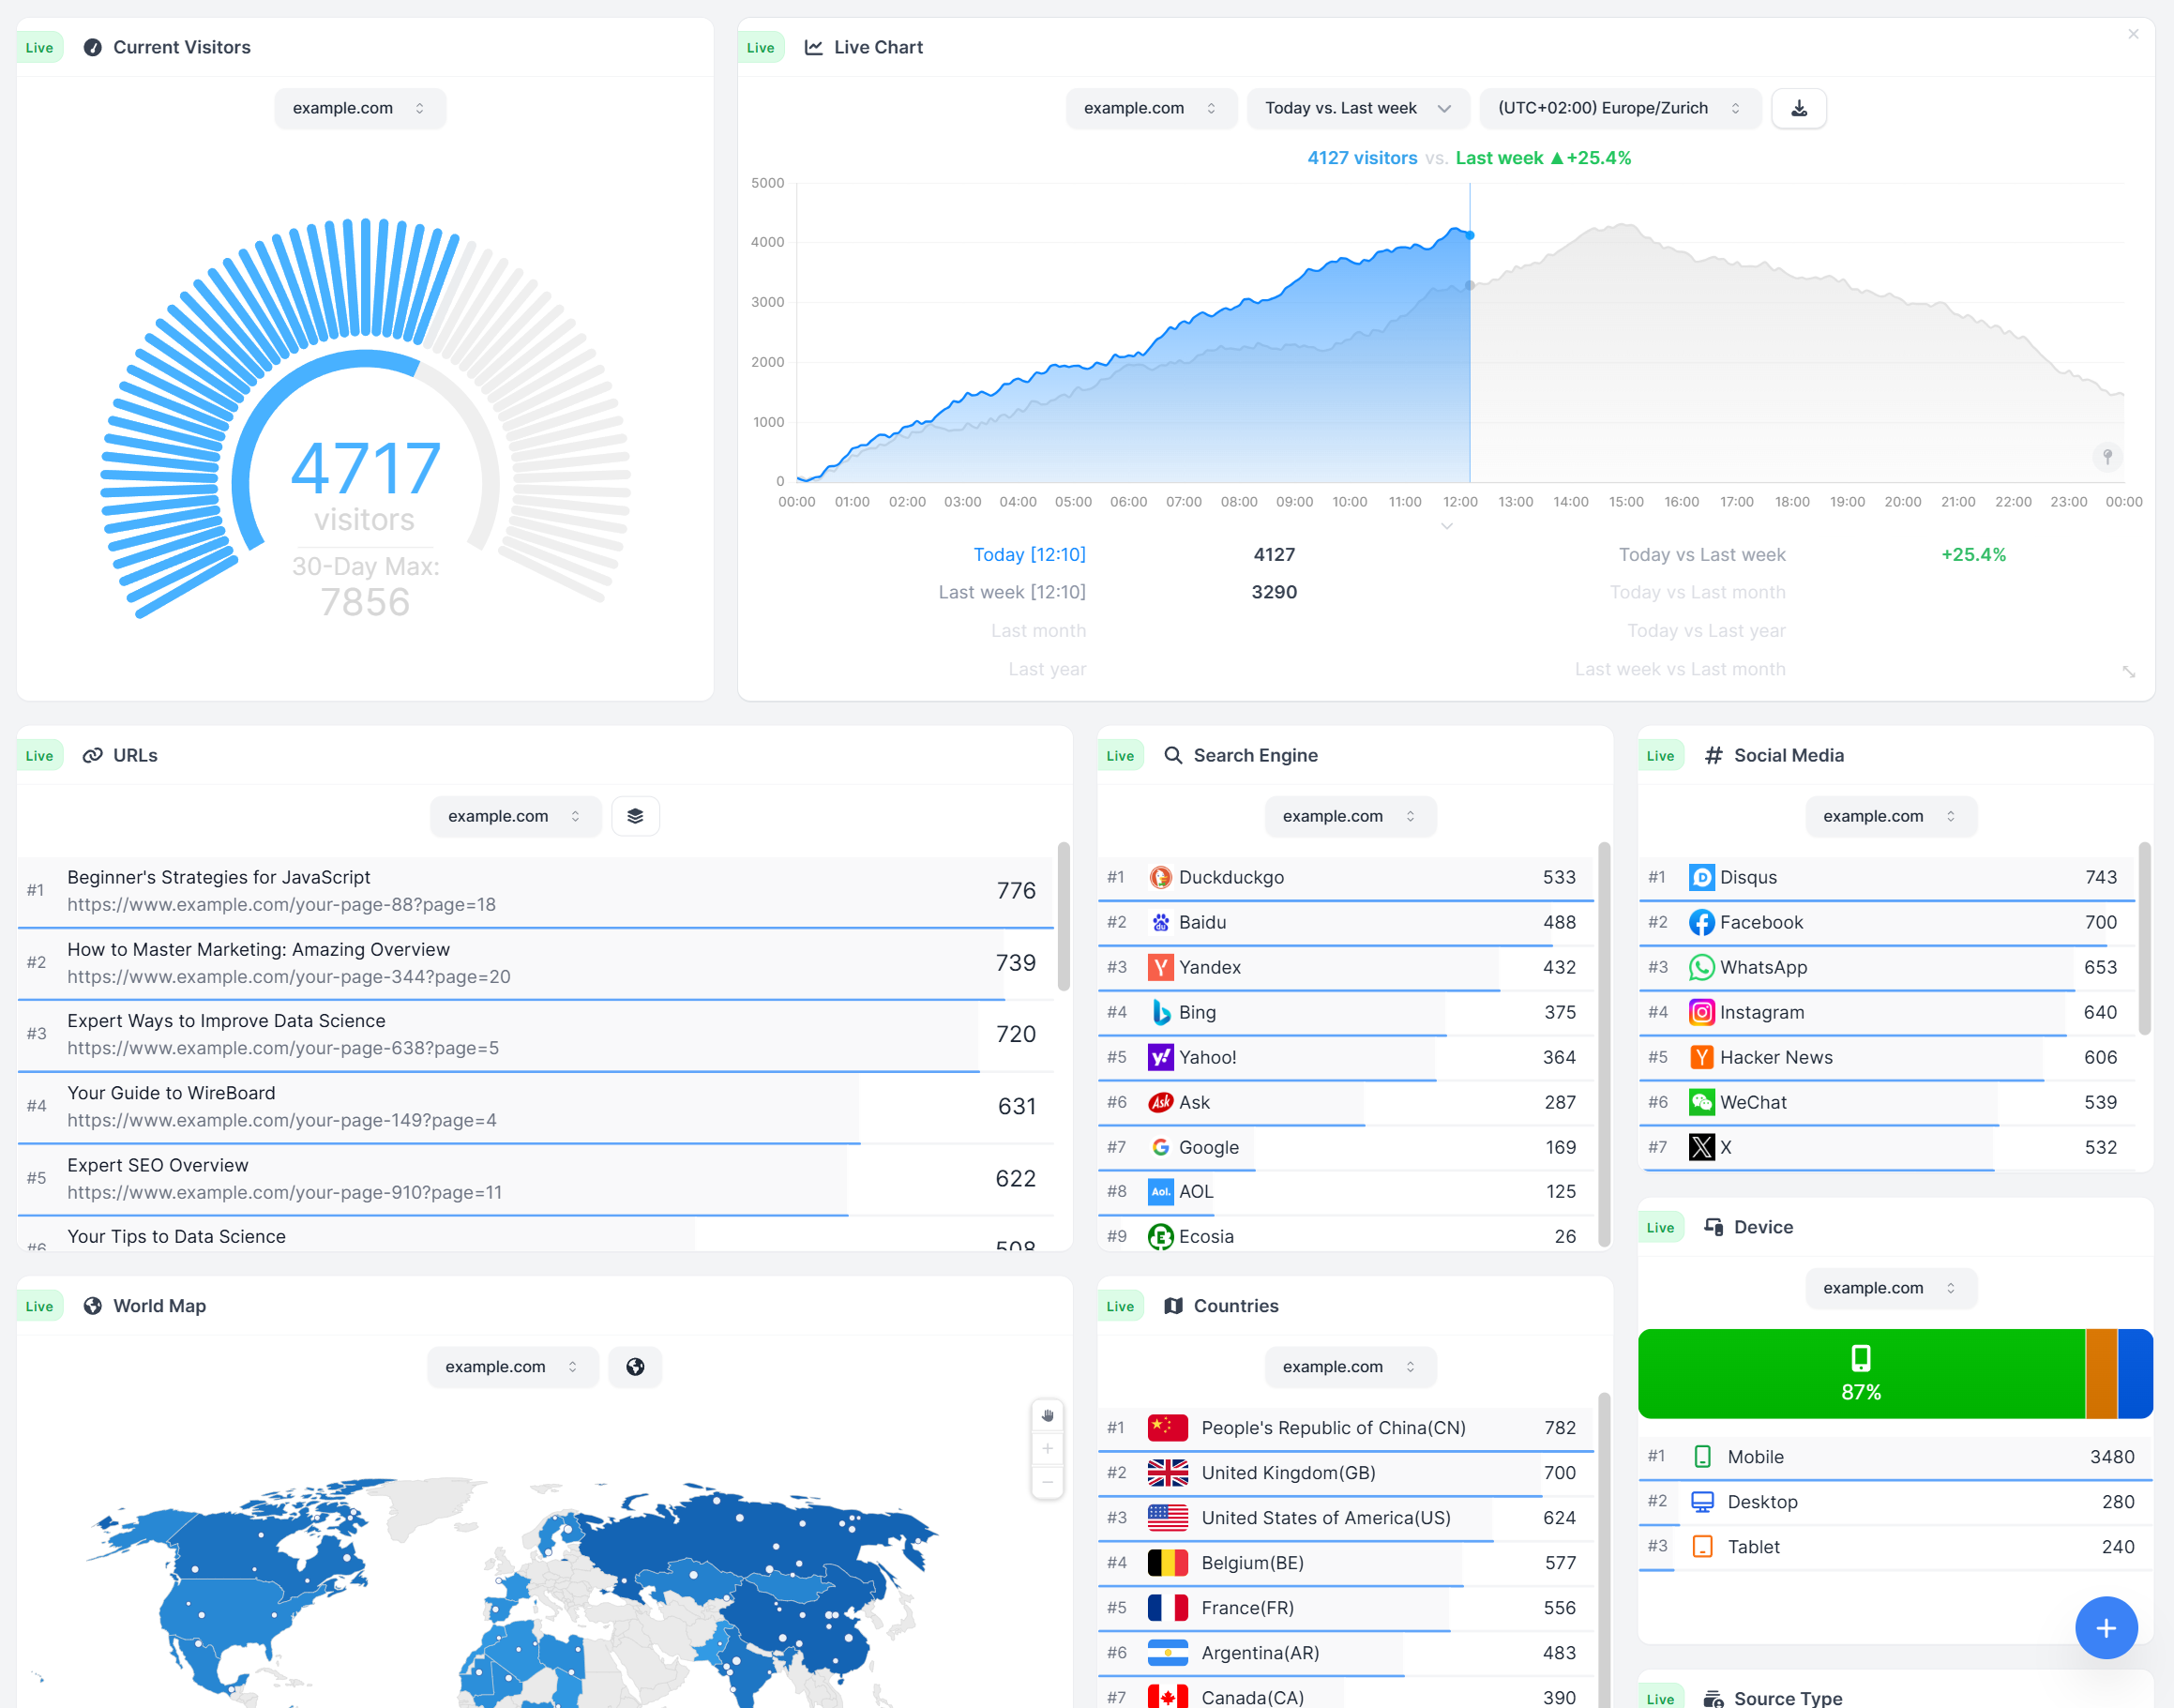
This is WireBoard's hire. The default dashboard populates from the first hit. The live visitor counter sits front and centre. UTM, referrers, top pages, conversion goals, multi-site aggregation, and the SEO suite are all available on every plan, including the Free Plan. If your job is the website, WireBoard is the tighter fit.
2. You build a SaaS product and need to see what users do inside it
Your job is the app, not the marketing site. You ship features behind flags, A/B test them on logged-in users, replay sessions to chase bug reports, run surveys inside the product, and want a data warehouse to join product events against billing data. You are an engineer or work alongside engineers daily.
This is PostHog's hire, and it is not close. WireBoard does not ship session replay, feature flags, A/B testing, surveys, or a data warehouse. Those are real, structural advantages of PostHog for a product team. If your job is the in-product experience, PostHog is the tighter fit.
3. You do both, and you are wondering whether one tool covers it
The tempting answer is "use PostHog for everything and consolidate." It can work, especially within PostHog's free tier. PostHog's web analytics dashboard covers visitors, sessions, paths, channels, UTMs, retention, an active-hours heatmap, conversion goals, and a world map, and it keeps improving. Its real-time view, by PostHog's own description, is currently in alpha and built around a stream of individual events rather than a board of dedicated live widgets. WireBoard's web analytics is the whole product: streaming live widgets on day one, multi-site aggregation, SERP volatility, the Google update timeline, an annotations layer, three years of retention from $9/mo.
For most hybrid teams, the practical answer is "PostHog inside the app, WireBoard on the marketing and content surface." Both tools are cheap enough at low volume that running them in parallel on different jobs is a real option.
Where PostHog wins outright
PostHog ships several things WireBoard does not. If any of them are central to your work, pick PostHog.
Session replay. Web and mobile recordings of individual sessions. WireBoard does not offer session replay.
Feature flags and experiments. Roll features out to cohorts, run A/B tests, tie the variants to product analytics events in one place. WireBoard does not offer this.
In-product surveys. PostHog ships a survey system that runs inside your product. WireBoard does not.
Error tracking, a data warehouse, and a CDP. PostHog's wider platform brings these in alongside analytics. WireBoard is web analytics, not a data warehouse or an error tracker.
Open-source self-hosting. PostHog's hobby deploy is MIT-licensed. From their self-host docs, you take on infrastructure responsibility, you receive no commercial support, and paid-plan features are Cloud-only. With those caveats, you can run it on your own server. WireBoard is closed-source and Cloud-only.
A generous event-based free tier. PostHog's free tier covers up to 1,000,000 product analytics events per month, plus separate free tiers across replay, flags, surveys, and other products. For a small SaaS or a low-volume site, PostHog can sit at $0 for a long time.
Those are five product-capability gaps, not marketing claims. (WireBoard now also ships a public read API, both REST and a Live SSE stream, so the API gap that used to live in this section is closed.)
Where WireBoard wins on its home turf
Now flip the question. On the web analytics surface, where both tools compete most directly, here is the list of WireBoard capabilities with no PostHog equivalent in the documentation.
Streaming live widgets across the website board. A live visitor counter and a live view of pages being read anchor WireBoard's dashboard from the first hit. Surrounding them are real-time funnels, the live world map, device breakdown, traffic sources, and the rest of WireBoard's 20+ live widgets, each pushing updates as events arrive. PostHog's Live tab, in their own wording, is currently in alpha and presented as an event feed covering "roughly the last few minutes." On WireBoard, live is the floor, not an alpha tab.
60+ drag and drop widgets, multiple dashboards per site, three themes. Build a live operations board, a weekly review board, a client-facing board. Three themes (Light, Dark, Future). PostHog has rich custom dashboards on the Product Analytics side; its Web Analytics dashboard itself is a fixed overview layout.
Multi-site live aggregation in a single widget. Point any WireBoard widget at one site, or aggregate live traffic across any selection of your sites in the same widget. PostHog runs a project per site. For an agency or a multi-brand operator, this is the most visible web analytics gap between the two tools.
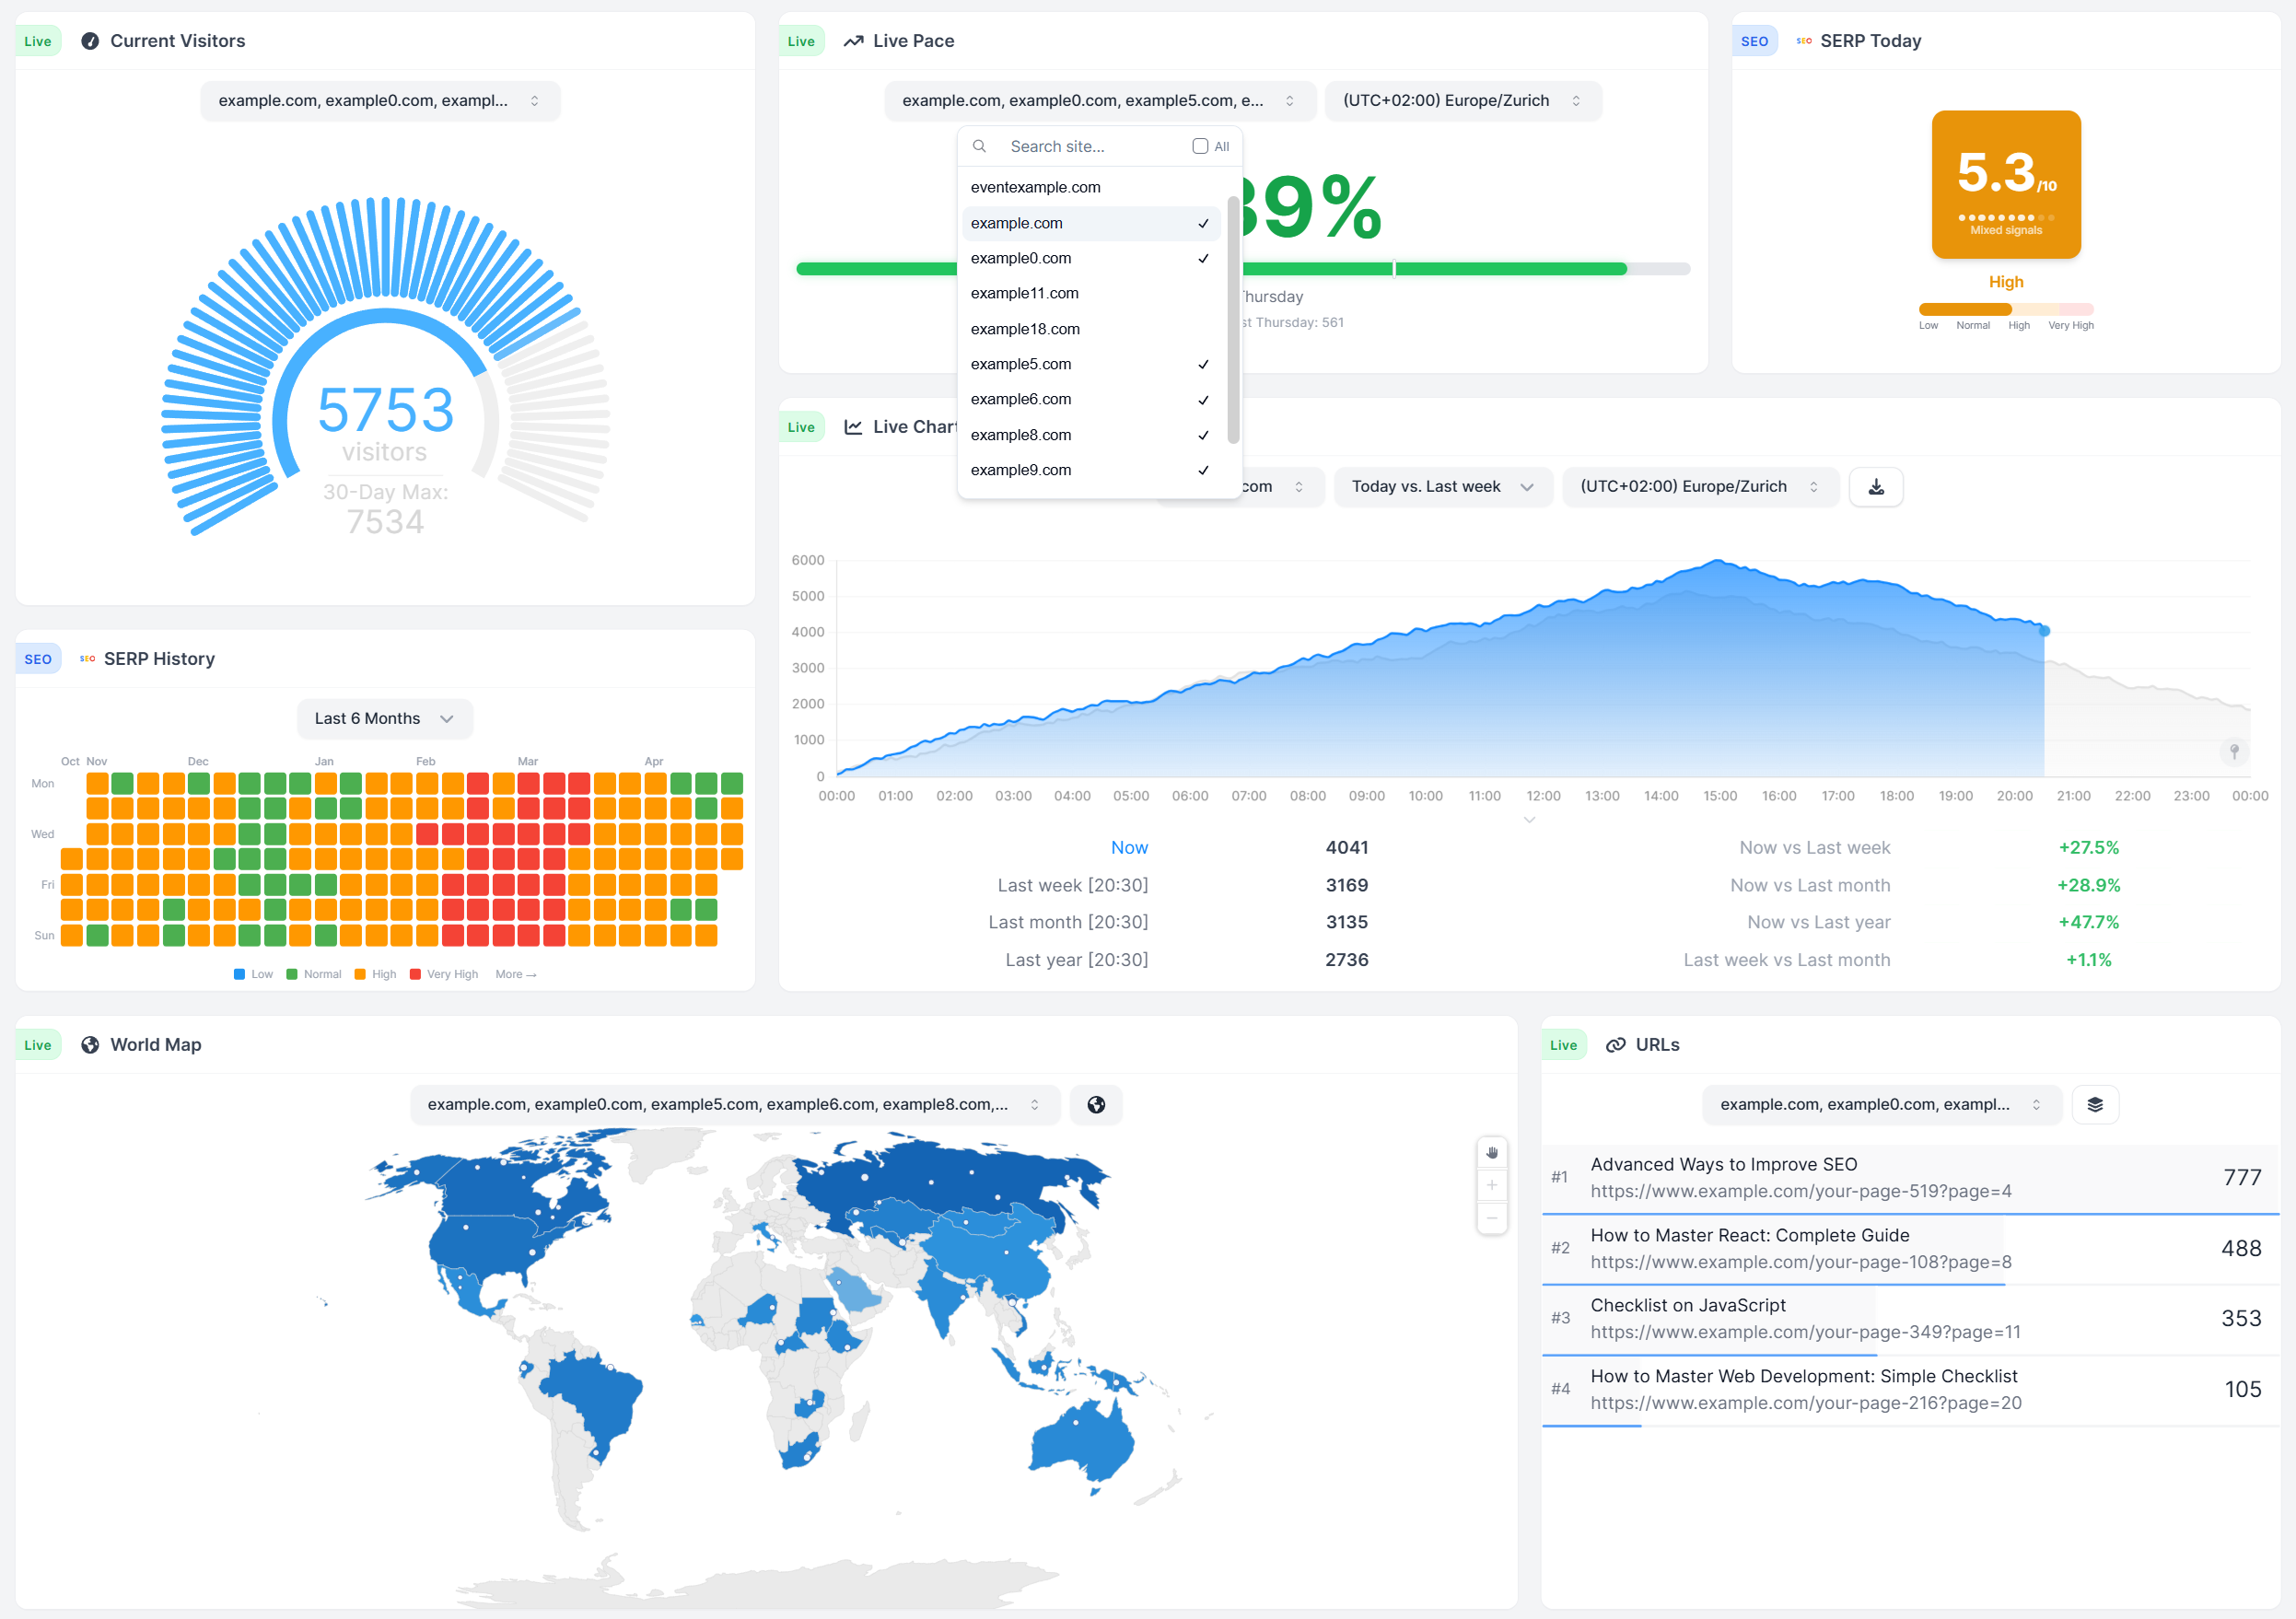
SERP Volatility live dashboard, Google Updates timeline, per-country holiday annotation overlay. PostHog does not ship a SERP volatility tracker or a Google algorithm-update timeline. WireBoard does, and on algorithm-panic days the difference between a 30-second briefing and an hour of guessing is the point.
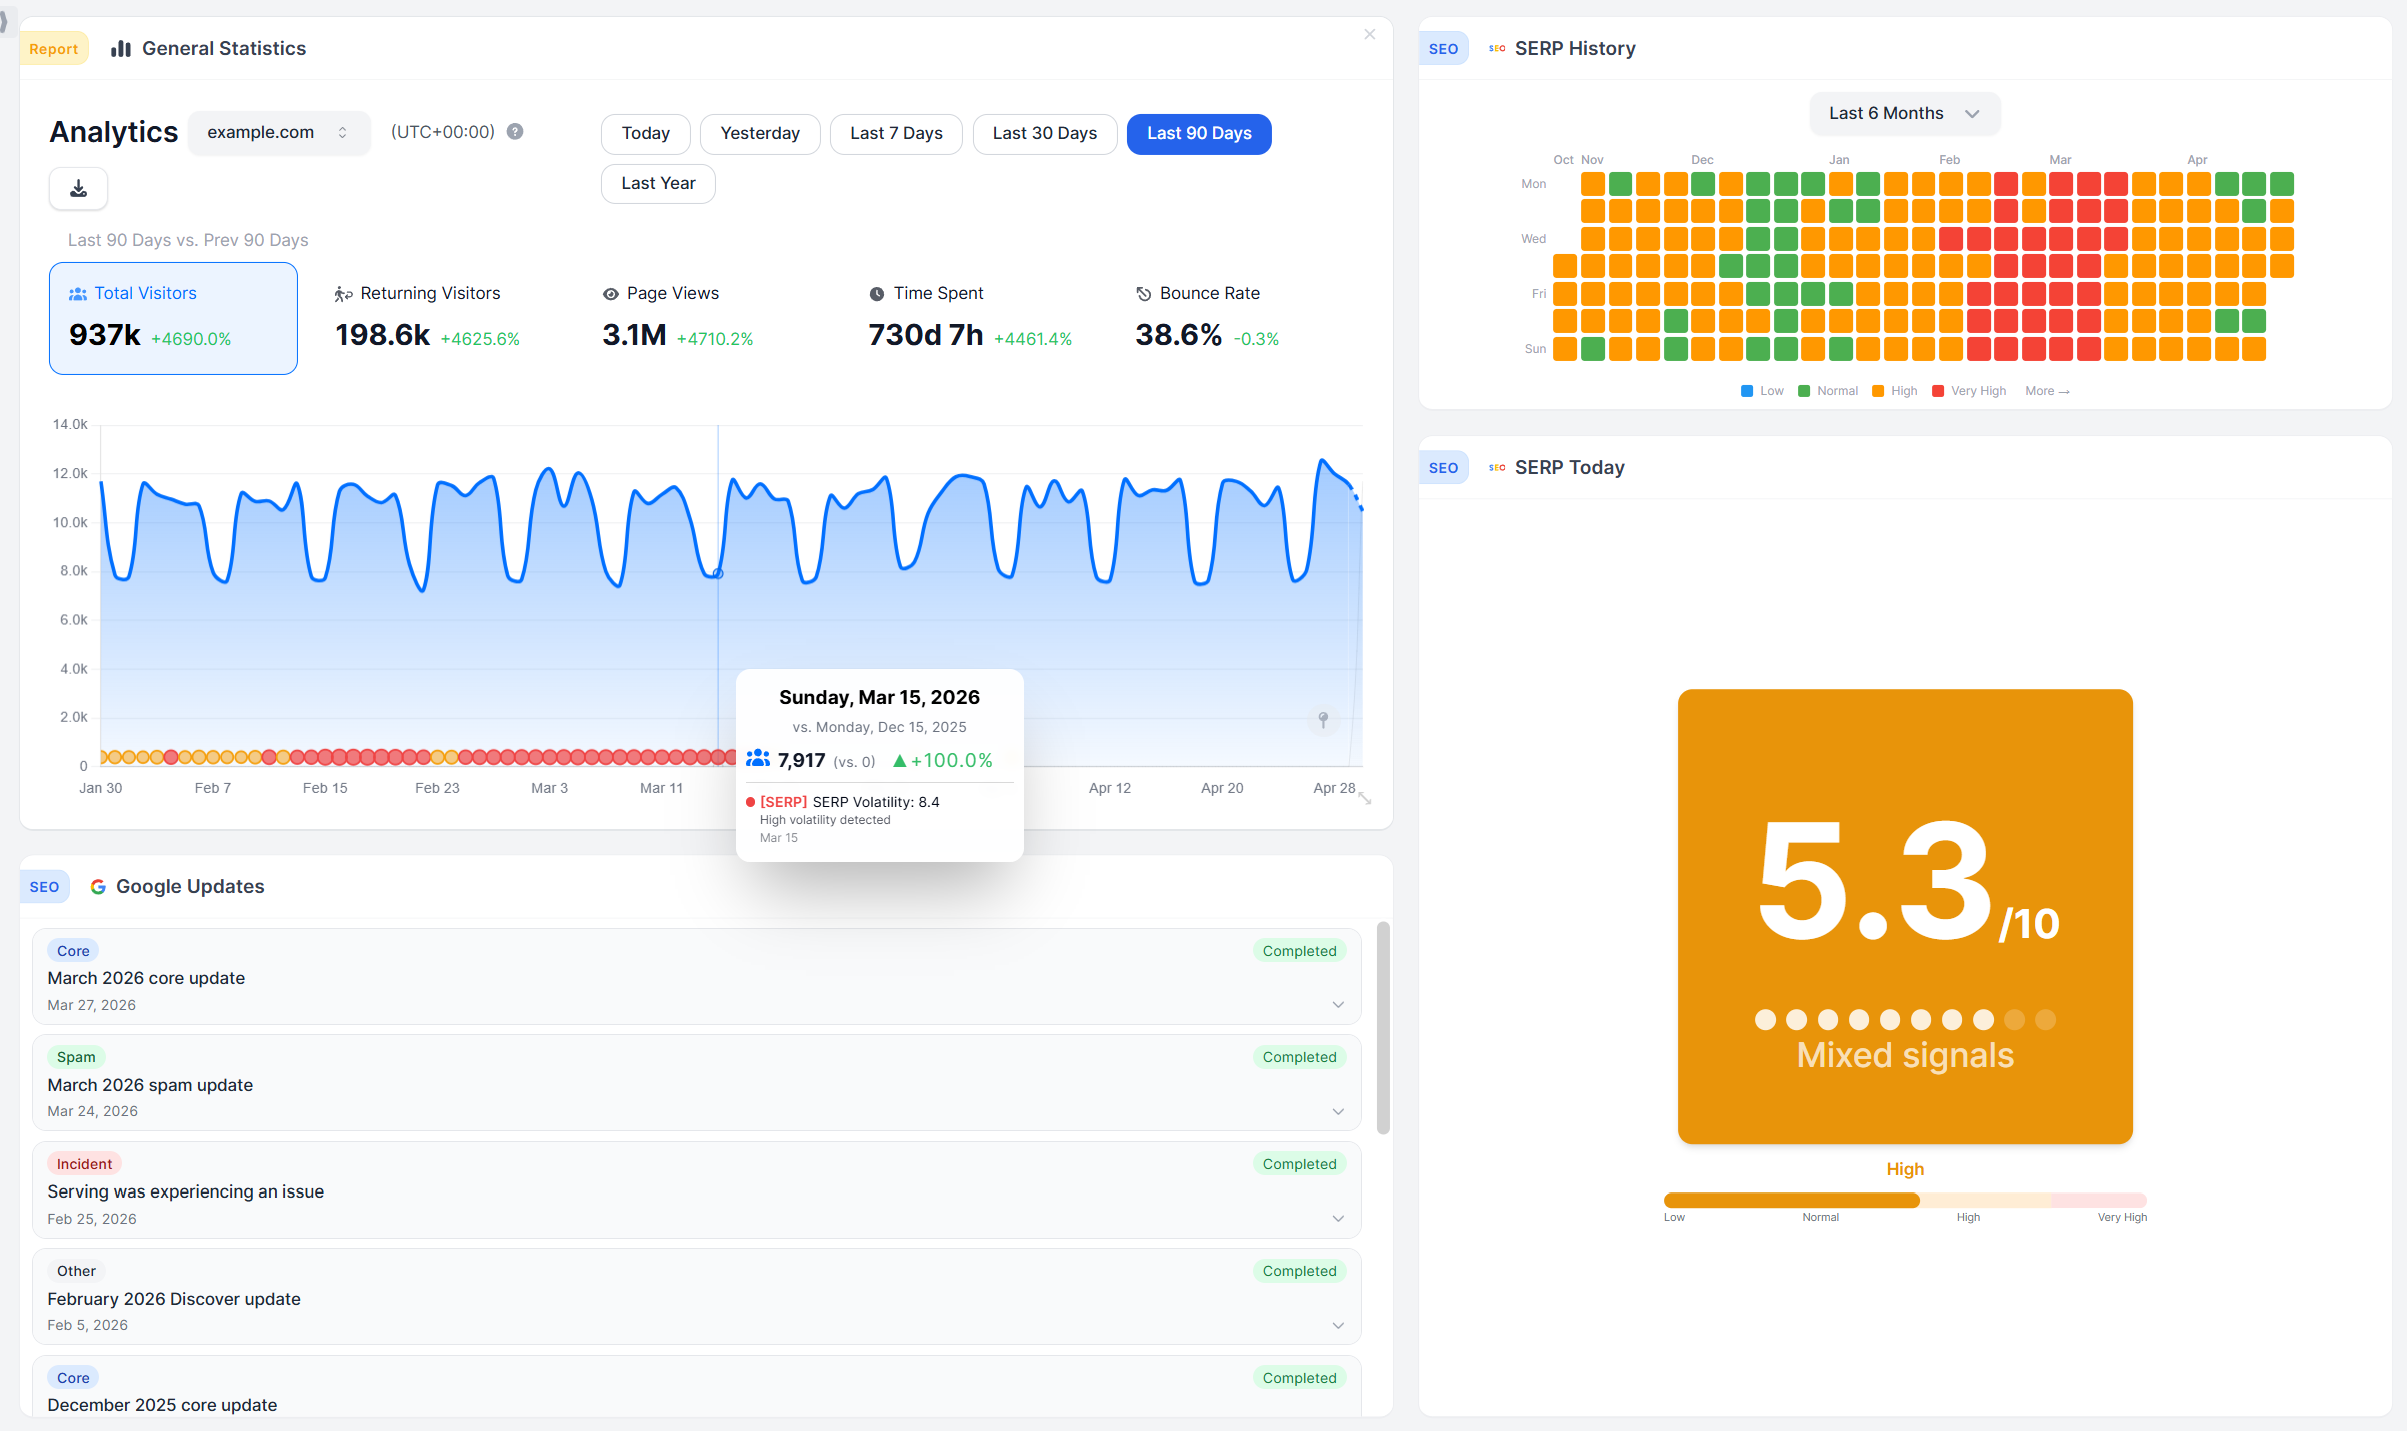
Annotations across every time-axis chart. Four shipped annotation layers (My Events, Google Updates, SERP Volatility, Public Holidays) plus per-user notes anchored to the date axis.
Streamer Mode and one-keystroke screenshot capture. For client demos and screen shares without revealing your domains, URLs, or page titles.
Real-time funnels with revenue per event property value. Track revenue by plan tier, by country, by source, in real time.
Per-graph or per-site timezone. Useful when sites span regions.
A permanent free plan with every feature. 50,000 page views per month, 2 sites, 3 dashboards, 30-day retention, every WireBoard feature unlocked, no credit card.
The PostHog alternative case for WireBoard
Many people land here once they realize what they really need is live web analytics, not a developer platform. WireBoard's lead is live data: the concurrent-visitor counter, the live feed of currently-read pages, the world map, and traffic sources all stream the moment a hit lands, not collected into an alpha-stage Live tab. Around that streaming core: more than sixty drag-and-drop widgets, multiple dashboards per site, three themes, and a populated default template the minute you sign up.
Need to aggregate live traffic across multiple sites in one widget? WireBoard does it streaming, while PostHog runs one project per site. Google-update morning? SERP volatility and the Core-and-Spam-Update timeline sit right next to your traffic, which PostHog does not ship. Need real-time funnels with revenue broken out by plan tier or country? They are on every plan.
A permanent Free Plan covering 50,000 page views, 2 sites, and 3 dashboards, with no per-product usage billing. If web analytics is the work itself and not a subset of a product platform, WireBoard is the PostHog alternative built for the website.
How the pricing actually plays out
Prices below were recorded from each company's published pricing page in May 2026. Both PostHog and WireBoard adjust pricing periodically. Before making a buying decision, verify current rates on the PostHog pricing page and the WireBoard pricing page.
The two pricing models reflect the two product shapes. PostHog prices by usage on each product you turn on, with a generous free tier on every one of them. WireBoard prices by page views per month, with every feature on every plan and a flat ladder.
PostHog's model
PostHog Cloud has two plans: Free and Pay-as-you-go. Both share the same per-product free tier every month. Beyond it, you pay per event, per recording, per feature-flag request, per survey response, with rates that drop as volume rises. Add-on packages (Boost $250/mo, Scale $750/mo, Enterprise $2,000/mo) layer on platform features like dedicated support, RBAC, and SSO enforcement.
| PostHog plan | Base price | Includes |
|---|---|---|
| Free | $0 | 1M product analytics events/mo, 5K session replays/mo, 1M feature-flag requests/mo, 100K exceptions/mo, 1,500 survey responses/mo, 1 project, 1-year retention |
| Pay-as-you-go | $0 base + usage | Same free-tier amounts free every month, then usage rates; 6 projects, 7-year retention, email support |
| Boost add-on | +$250/mo | Platform features |
| Scale add-on | +$750/mo | Platform features |
| Enterprise add-on | +$2,000/mo | Platform features |
Web analytics events are billed alongside product analytics, at the same per-event rate.
WireBoard's tiers
WireBoard ships nine plans, starting at $0 forever. Yearly billing saves about 17% (two months free). Every paid tier includes every feature.
| WireBoard plan | Monthly | Page views/mo | Sites | Dashboards | Team seats | History |
|---|---|---|---|---|---|---|
| Free Plan | $0 | 50,000 | 2 | 3 | 1 | 30 days |
| Micro | $9 | 100,000 | 50 | 100 | 3 | 3 years |
| Small | $19 | 250,000 | 50 | 100 | 5 | 3 years |
| Medium | $24 | 500,000 | 50 | 100 | 10 | 3 years |
| Large | $49 | 1,000,000 | 50 | 100 | 15 | 3 years |
| Extra Large | $99 | 3,000,000 | 50 | 100 | 20 | 3 years |
| Pro | $199 | 6,000,000 | 50 | 100 | 30 | 3 years |
| Pro Plus | $399 | 12,000,000 | 100 | 200 | 50 | 3 years |
| Enterprise | Custom | Custom | Unlimited | Unlimited | Unlimited | Custom |
Three differences that actually move the buying decision
- Quota unit is different. WireBoard's quota is page views per month. PostHog's quota is events per month, metered separately per product. A pure web analytics workload can sit inside PostHog's free tier for a long time. A workload that turns on session replay, flags, surveys, and the warehouse will see costs scale across all of them. That is the trade-off for the platform breadth.
- Free tier shape. PostHog's free tier is generous on event volume, modest on retention (1 year) and projects (1). WireBoard's free tier is fixed on volume (50,000 page views/mo) and unlimited on the WireBoard feature set: SEO suite, multi-site, annotations layer, real-time funnels, all included. Which free tier is "more generous" depends on the job, not on a sticker number.
- Predictability. WireBoard's $49/mo Large plan is $49/mo at one million page views with every feature on. PostHog's monthly bill scales by event volume across whichever products you've enabled. PostHog offers per-product billing limits to cap exposure, but the model is usage-based by design.
Pricing depends on the job. For a content site at 100K page views/mo with no session replay or flags, PostHog can be free where WireBoard is $9/mo. For a multi-site agency at 1M page views/mo that wants every feature with no per-product metering, WireBoard's $49/mo is the simpler answer.
Should you trust this comparison?
Fair question. Here is where I'm coming from.
I run WireBoard. PostHog comes up regularly when people are deciding what to use, so I've spent a lot of time reading their docs and pricing page to understand where they're the right answer and where we are. This post is what I'd send a prospect who emailed asking how the two compare on the website-analytics side. Where PostHog is the better fit, I say so. Where WireBoard is, I say that too.
Two more things worth weighing.
Verifiability. Every claim about PostHog in this post is grounded in PostHog's own pricing page, public documentation, or GitHub repository, all linked in the Sources block at the bottom. Every claim about WireBoard is grounded in shipping product. Where something is on our roadmap and not yet live (Slack-native reporting, configurable traffic-spike alerts), I have said so out loud.
Customer signal. WireBoard is used by people whose job is the website in front of them, including Barry Schwartz of Search Engine Roundtable, Robert Farrington of The College Investor, and Jon James of TeamGreet. They picked WireBoard for specific reasons that line up with profile 1 above. If your operation looks like theirs, that signal is worth more than my framing.
Try both before you decide
You can read about it. You can also just install both.
PostHog's Free plan covers 1,000,000 product analytics events per month, no card. WireBoard's Free Plan never expires: 50,000 page views, 2 sites, 3 dashboards, every feature available, no card. Drop both scripts on one real site, send some traffic, and watch the dashboards diverge.
Three things to do:
- Open both side by side on one screen. Generate a visit yourself or have a colleague ping the site. Note where it shows up on each tool, and how fast.
- Pick one question that actually matters for your team and see which dashboard answers it first. "Which page is trending right now?" "Which UTM converted yesterday?" "Did the variant of feature X lift activations?" Whichever tool gets the answer first wins on your specific work.
- Model the bill at your real volume. Plug your expected event mix into PostHog's pricing calculator and compare it to the equivalent WireBoard tier. If you plan to turn on session replay, flags, and surveys, model all three.
A few days of real traffic on both dashboards turns the category mismatch above from abstract to obvious.
Pros and cons at a glance
| WireBoard | PostHog | |
|---|---|---|
| + | ✅ Streaming live widgets, day one ✅ 60+ widgets, fully customizable ✅ Multi-site live in one view ✅ SERP volatility + Google update tracking ✅ Every feature on every plan ✅ Public REST + Live SSE API |
✅ Session replay, web and mobile ✅ Feature flags + A/B testing ✅ MIT self-hostable hobby deploy ✅ Public read API |
| − | ❌ No session replay ❌ No feature flags or experiments ❌ No open-source self-hosting |
❌ Live web tab in alpha ❌ No multi-site live aggregation ❌ No SERP / Google-update tracking ❌ Web analytics dashboard is fixed layout |
The bottom line
When PostHog is the right pick
PostHog wins in two narrow situations: you build an in-product user experience that needs session replay, feature flags, A/B testing, surveys, or a unified data warehouse alongside your analytics, or open-source self-hosting is non-negotiable on the analytics layer. If that's you, install PostHog and move on.
Why people choose WireBoard
If your job is the website itself, WireBoard wins on the things that actually matter day to day, and it isn't close.
Live data from the first hit. Visitor counter, live pages, world map, traffic sources, real-time funnels: all streaming, not collected into an alpha-stage tab. Multi-site live aggregation in a single widget, which PostHog runs a project per site to approximate and still doesn't deliver. SERP volatility and the Google algorithm-update timeline sit next to your traffic on the same board: on update mornings, that's a thirty-second briefing instead of an hour of guessing. Sixty-plus drag-and-drop widgets, multiple dashboards per site, three themes, and a populated default template the moment you sign up. A public REST + Live SSE API, official JS and Python SDKs, and an MCP server, so you can pull your analytics into your own product or your AI assistant. Three-year retention from $9/month. Every feature on every paid plan, permanent Free Plan included. No tier-gated funnels, no tier-gated revenue tracking, no asterisks.
WireBoard is web analytics, built end to end for people whose job is the website. PostHog is a developer platform that includes web analytics as one component among many. If the website is your work, WireBoard is the answer.
Start tracking for free with WireBoard. 50,000 page views per month, 2 websites, 3 dashboards, every feature included. No credit card. No trial period. No catch.
Sources
WireBoard
- WireBoard homepage
- WireBoard pricing
- WireBoard features
- SERP volatility live tool
- Google Core and Spam Updates timeline
- WireBoard product timeline and changelog
- WireBoard privacy policy
- WireBoard documentation
PostHog (where the claims about their product are grounded)